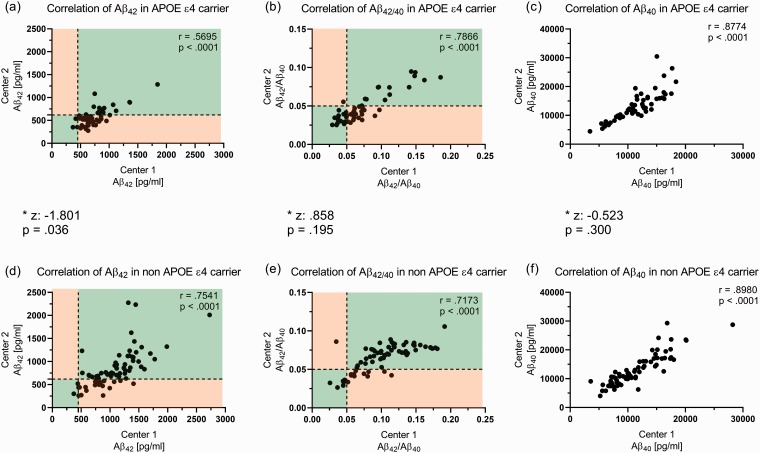
Figure 3.
Correlation of Aβ42, Aβ42/40, and Aβ40 between the two centers for APOE ε4 carriers (a to c) and non APOE ε4 carriers (d to f). Cases with CSF concentrations above the detection limit were excluded; 53 APOE ε4 cases (a to c) and 71 (e and f) or 70 (e) non APOE ε4 cases were included. Correlation was significantly lower (p = .036) in APOE ε4 carriers for Aβ42 between the two centers (a and d), whereas similar correlations could be observed for Aβ42/40 and Aβ40. Concordant CSF biomarkers were defined as consistent CSF levels in both centers above or below the corresponding cutoff values. Areas with concordant cases are colored green, whereas areas with discordant cases are colored orange in Panels (a), (b), (d), and (e). *Comparison of correlation between APOE ε4 carriers and noncarriers for each biomarker after Fisher r-to-z transformation. APOE = apolipoprotein E; Aβ = amyloid-beta; Aβ42 = Aβ 1-42; Aβ42/40 = Aβ42 to Aβ 1-40 ratio.

