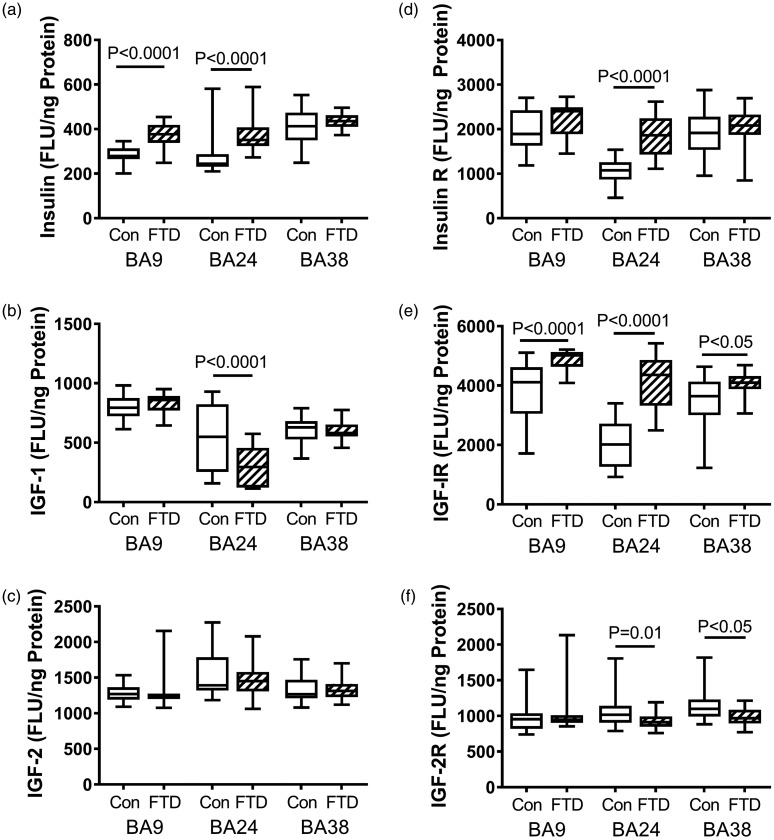
Figure 3.
FTD-associated regional changes in insulin/IGF trophic factors and receptors. Fresh-frozen postmortem microdissected control (n = 13) and FTD (n = 11) human brain samples from BA 8/9 (prefrontal), BA24 (anterior cingulate), and BA38 (temporal pole) were used to measure (a) insulin, (b) IGF-1, (c) IGF-2, (d) insulin receptor, (e) IGF-1 receptor, and (f) IGF-2 receptor by direct-binding ELISAs with results normalized to protein concentration. Levels of immunoreactivity were measured in arbitrary FLU. Box plots depict mean (horizontal bar), 95% confidence interval limits (upper and lower limits of the boxes), and range (stems). Data were analyzed by two-way ANOVA with the Tukey post hoc significance test. Significant between-group differences are indicated within the panels.
BA = Brodmann’s area; FLU = fluorescence light unit; FTD = frontotemporal lobar degeneration; IGF-1 = insulin-like growth factor-1; IGF-2 = insulin-like growth factor-2.

