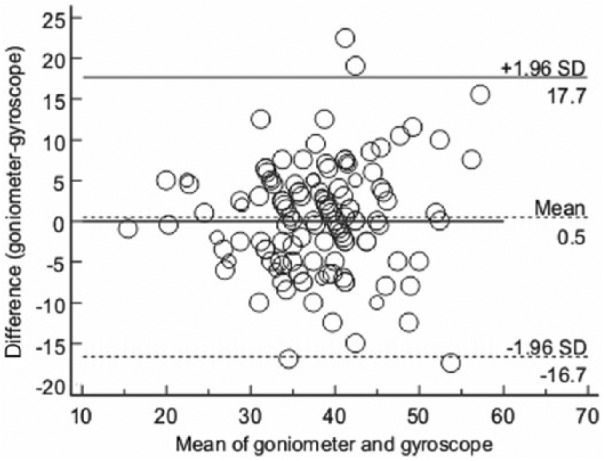
Figure 1.

Bland-Altman plot for wrist extension, flexion, ulnar deviation, radial deviation, plotting the difference between measurements with the gyroscope and the goniometer.
Note. The graph displays a scatter diagram of the differences plotted against the averages of the 2 measurements. Horizontal lines are drawn at the mean difference, and at the limits of agreement, which are defined as the mean difference plus and minus 1.96 times the standard deviation of the differences. The resulting plot demonstrates a random distribution (thus no systemic bias) and the mean coinciding with 0 value.
