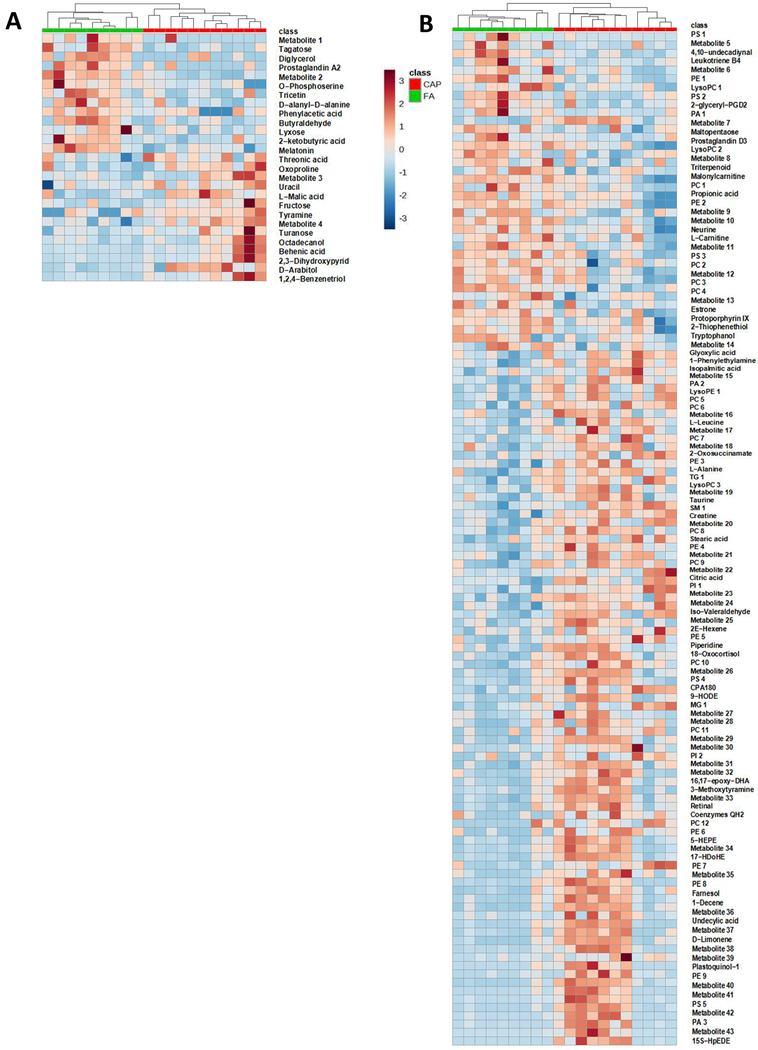
Figure 2. Heatmaps of differential metabolites.
Mice were exposed to FA or CAP for 10 months. Their sera were collected and subjected to LC-MS and GC-MS analyses. The identified differential metabolites were used to perform heatmap analyses. The color represents the metabolite concentration of each sample calculated by peak area normalization method.

