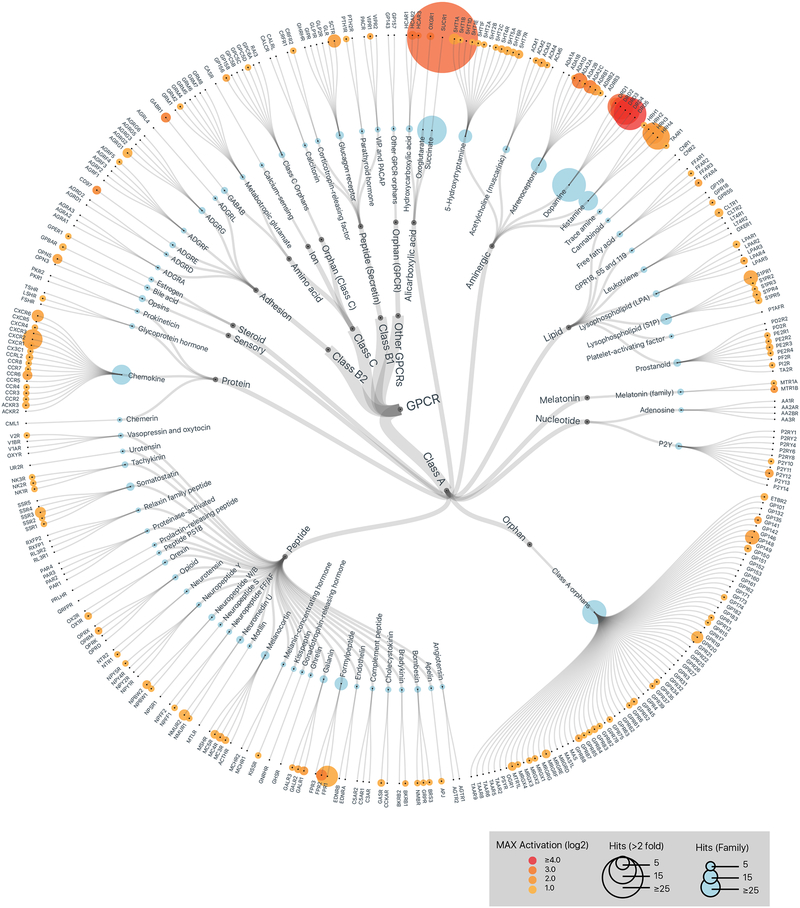
Figure 2. Members of the human gut microbiota produce metabolites that activate diverse human GPCRs.
GPCR activation by metabolomes from a human gut microbiota culture collection consisting of 144 strains isolated from 11 IBD patients. Data is displayed on a hierarchical tree of GPCRs organized by class, ligand type, and receptor family. Color intensity represents the maximum magnitude of activation (log 2) over background (gut microbiota medium alone) across the complete data set. Radii of the circles at each tip represent the number of strains that activated a given receptor or receptor family by more than two-fold over background. Graphics were generated in collaboration with visavisllc using d3.js.

