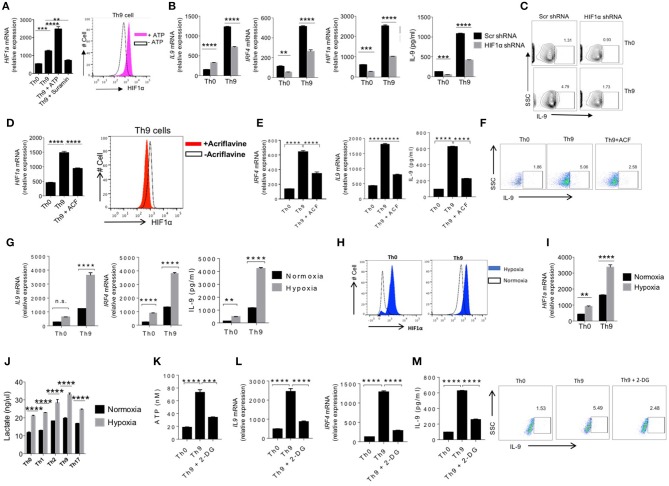
Figure 4.
ATP-induced HIF-1α is required for human Th9 cells differentiation. (A) Sorted naïve T cells were differentiated under Th0 and Th9 polarizing conditions for 6 days in the presence of ATP and Suramin followed by examination of mRNA expression of HIF1α and intracellular cytokine staining for HIF1α. (B) Sorted naïve T cells were nucleofected with naked scramble shRNA and HIF1α shRNA and were differentiated under Th0 and Th9 polarizing conditions for 6 days analyzed for mRNA expression of IL-9, IRF4, HIF1α and IL-9 production in the culture supernatants by ELISA (C) Intracellular cytokine staining of IL-9 in Th9 cells. (D) Sorted naïve T cells were differentiated under Th0 and Th9 polarizing conditions for 6 days in the presence and absence of acriflavine (ACF) followed by examination of mRNA expression of HIF1α and intracellular cytokine staining for HIF1α. (E) mRNA expression of IL-9, IRF4 and IL-9 production in the culture supernatants estimated by ELISA. (F) Intracellular cytokine staining for IL-9 expression (G) Sorted naïve T cells were differentiated under Th0 and Th9 polarizing conditions for 6 days in normoxia (21% oxygen) and hypoxia (1% oxygen), respectively. Total RNA was extracted, reverse transcribed and real-time PCR was done for analyzing mRNA expression of IL-9 and IRF4 and IL-9 production in the culture supernatants estimated by ELISA. (H) Intracellular cytokine staining of HIF1α and (I) mRNA expression of HIF1α. (J) Sorted naïve T cells differentiated under Th0, Th1, Th2, Th9, and Th17 polarizing conditions for 6 days in normoxia (21% oxygen) and hypoxia (1% oxygen), respectively followed by measurement of lactate production in culture supernatants. (K) Sorted naïve T cells were differentiated under Th0 and Th9 polarizing conditions for 6 days in the absence and presence of 2-DG followed by estimation of ATP production in culture supernatants. (L) mRNA expression of IL-9 and IRF4. (M) Estimation of IL-9 production in culture supernatants by ELISA and intracellular cytokine production of IL-9. Data are representative of mean ± SEM from three independent experiments (n = 3). *P < 0.0332, **P < 0.0021, ***P < 0.0002, ****P < 0.0001; one-way ANOVA followed by Tukey's test (A,D,E,K–M), two-way ANOVA followed by Tukey's test (B,G,I,J).

