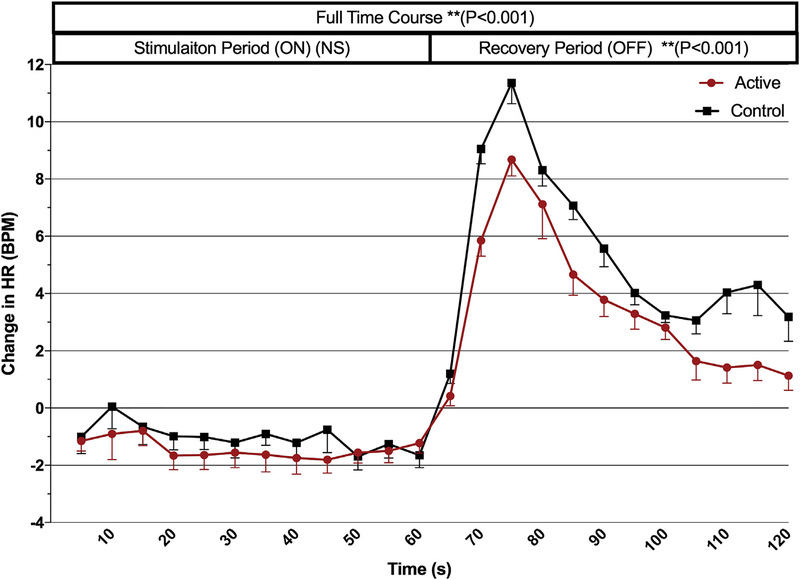
Fig. 3. Time course analysis for trial 1.
All 9 stimulation parameters’ effect on mean heart rate (grouped by condition, active/control) are represented in this time course analysis. An overall effect of condition is revealed (120s time course, p < 0.001), as well as the blunting of HR spike by active stimulation during the recovery period (p < 0.001). (Error bars = SEM).

