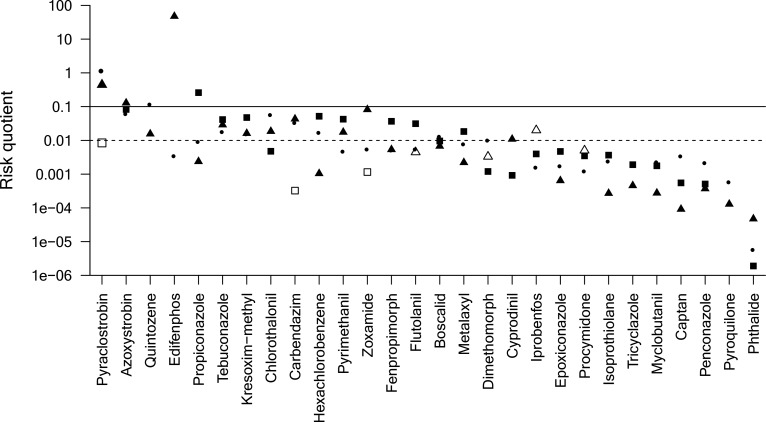
Figure 5.
Risk quotients for algae (squares), fish (circles), and invertebrates (triangles) as ratios of maximum detected global field concentrations (SI Table S1; substances with ≥10 observations) and acute standard toxicity data (i.e., the base set; provided by the Pesticide Properties DataBase40). Open symbols indicate that toxicity was provided as “greater than” values. Risk quotients >0.01 (dashed line) and >0.1 (solid line) indicate moderate and high risks, respectively. Substances are ordered from highest to lowest risk according to the classification: high risk for several test organisms > high risk for one test organism and moderate risk for two test organisms > high risk for one test organism and moderate risk for one test organism > high risk for one test organism > moderate risk for three test organisms > moderate risk for two test organisms > moderate risk for one test organisms > unclear risk (i.e., toxicity value provided as “greater than” value) > all test organisms low risk. If substances scored equal, the mean risk quotient determined ranking. For risk quotients sorted by continent, see SI Table S4.

