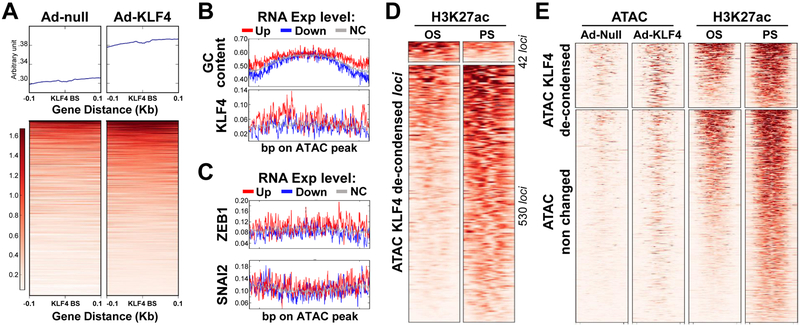
Figure 2. KLF4 regulation of PS-induced genes via chromatin remodeling, assessed by ATAC-seq.
HUVECs were transfected with Ad-null or Ad-KLF4 for 24 hr. Cells were subjected to ATAC-seq. (A) ATAC peaks from Ad-null or Ad-KLF4-infected ECs were initially merged into a union set of ATAC peaks. The KLF4 putative binding sites within the ATAC peaks were then predicted. The upper and lower panels show the overall and per-loci ATAC signals at ± 0.1 kb flanking the putative KLF4 binding sites. (B, C) ATAC loci were first divided into 3 groups by the expression levels of their closest genes induced by PS. The assessed GC ratio or frequency of putative TF binding in these loci are summarized in the representative heat maps. The x-axis represents the position of the de-condensed loci and the y-axis the frequency of changes. (D) Heat maps showing 572 loci de-condensed by KLF4, as assessed by ATAC-seq. These loci coincide with the PS- or OS-associated H3K27ac enrichment. (E) Heat maps of the ATAC-seq and H3K27ac ChIP-seq signals in loci de-condensed or not by KLF4. Distance at the abscissa denotes the relative location within the loci, and each row represents a locus.

