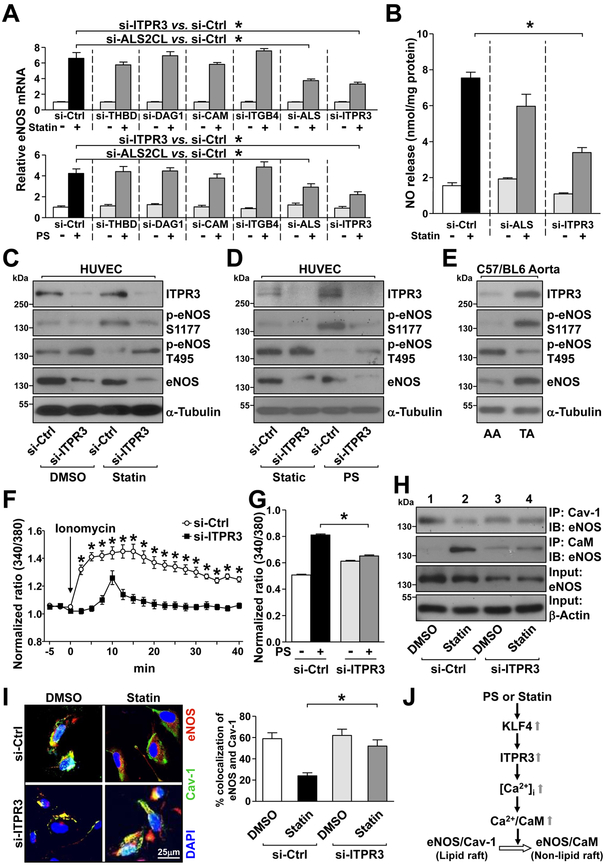
Figure 5. Atorvastatin and PS upregulate the ITPR3-eNOS axis in ECs.
(A) HUVECs were transfected with siRNA against THBD, DAG1, CAMKK1, ITGB4, ALS2CL, or ITPR3 for 48 hr. In control experiments, HUVECs were transfected with control siRNA. After atorvastatin (5 μM) or PS stimulation for the last 16 hr, cells were lysed and eNOS mRNA level was detected by RT-qPCR. (B) HUVECs were transfected with ALS2CL siRNA, ITPR3 siRNA, or control siRNA. After atorvastatin stimulation for 1 hr, NO level was detected by Griess reagent. (C, D, F, G, H, I) HUVECs were transfected with ITPR3 siRNA or control siRNA, and then stimulated with atorvastatin (C, H, I) for 1 hr, PS for 1 hr (D), or PS for 10 mins (G). (E) Tissues isolated from TA and AA of C57BL/6j mice (pooled from 3 male and 2 female mice). In (C-E), the cellular or tissue extracts were examined by western blot analysis for protein levels of ITPR3, p-eNOS T495, p-eNOS S1177, eNOS, and α-tubulin. In (F, G), ECs were treated with Fura2-AM for 1 hr before stimulation with ionomycin (2 μM, F) or PS (G). The calcium influx rate was detected by comparing the 340/380-nm ratio under a fluorescence microscope. Overall, 12–15 cells (F) or 130–160 cells (G) were randomly chosen to detect the fluorescence in each group. In (H), cell lysates were immunoprecipitated (IP) with anti-Cav-1 or anti-calmodulin (CaM) antibody. The co-immunoprecipitated eNOS was evaluated by immunoblotting (IB), with β-actin as a loading control. In (I), immunostaining was performed with anti-eNOS (red) or anti-Cav-1 (green) antibody. Nuclei were counterstained with DAPI (blue). Fluorescence was detected under an Olympus confocal microscope. The colocalization of eNOS and caveolin-1 was quantified by ImageJ. (J) A working model of atorvastatin and PS regulation of the ITPR3-eNOS axis via KLF4. Data are mean ± SEM from at least 3 independent experiments. For parametric data (F, G, I), statistical significance was determined by 2-tailed Student’s t test between two indicated groups. Non parametric data (A, B) were analyzed using Kruskal-Wallis with Dunn’s post-hoc test. *P < 0.05.

