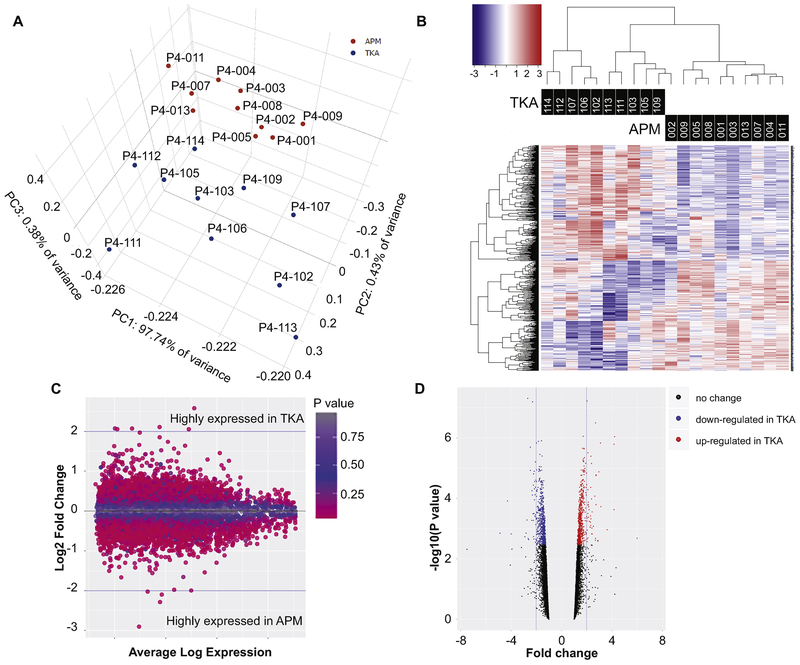
Figure 1.
A). Principal components analysis of 10 APM and 10 TKA samples showed clear distinction between two groups. Each dot represents one patient. B). Normalized gene expression level (z-score) of DE transcripts between APM and TKA patients were used to generate heatmaps. Color bar above heatmaps indicates patients’ metadata in which patients were mainly clustered. Based on DE transcripts, TKA and APM samples were distinctly separated. C). Expression fold-change (FC) and averaged expression level of DE transcripts between APM and TKA patients are shown in the form of an MA plot. D). The differentially expressed transcripts at ≥ 2 fold-change are depicted in volcano plots to pictorially represent trend of expression by P-value (y-axes) and fold-change (x-axes).

