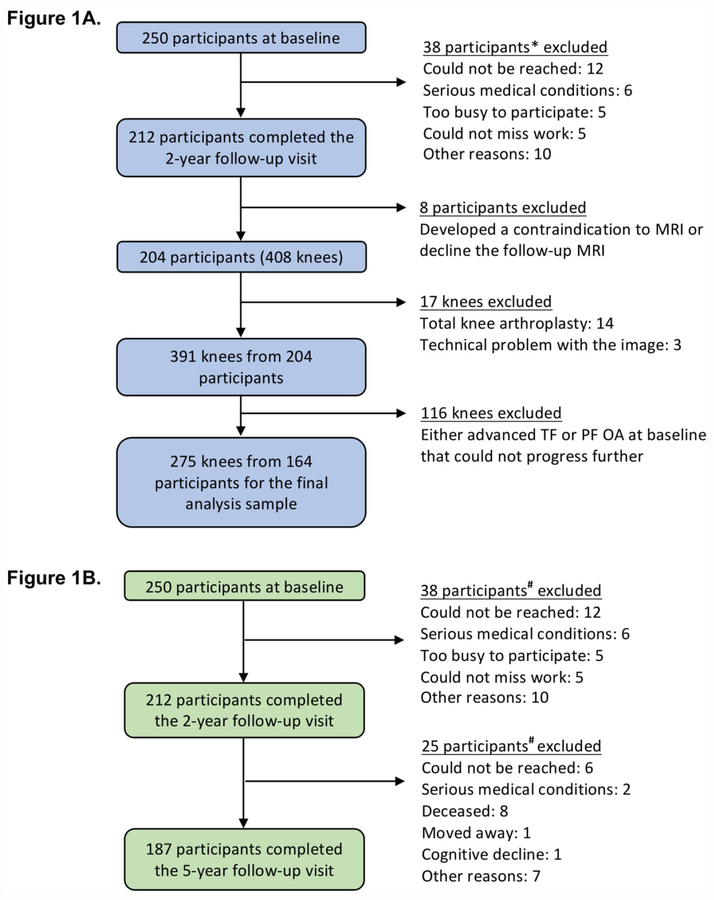
Figure 1. Derivation of Analysis Samples for the 2-year cartilage damage worsening (1A) and 5-year poor function and disability outcomes (1B).
* Compared to those who completed the 2-year visit (n=212), those (n=38) not completing the 2-year visit did not differ statistically with respect to sex distribution (71.7% female in non completers versus 76.5% in completers), BMI (mean 28.9 kg/m2, SD 5.1 versus 28.5, 5.7, respectively), or disease severity by K/L grade (38.1% had K/L grade 3 or 4 versus 31.4%), but were statistically slightly older (mean 68.1 years, SD 11.1 versus 64.2, 10.0).
# Compared to those who completed the 5-year visit (n=187), those (n=63) not completing the 5-year visit did not differ statistically with respect to sex distribution (66.7% female in noncompleters versus 78.6% in completers), BMI (mean 28.3 kg/m2, SD 4.9 versus 28.6, 5.8), or disease severity by K/L grade (39.7% had K/L grade 3 or 4 versus 29.9%), but were statistically slightly older (mean 67.4 years, SD 11.6 versus 64.2, 9.7).

