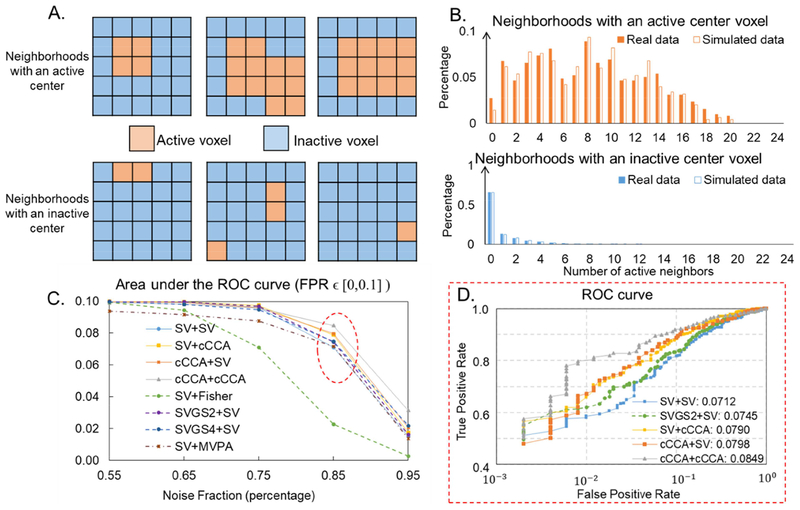
Figure 1.
Simulation: Within-group activation detection. (A). Examples of simulated 5×5 neighborhoods with an active (top) or inactive (bottom) center voxel. (B). The distribution of number of active neighbors with an active (top) or inactive (bottom) center voxel in both real data (filled) and simulated data. (C). Area under the ROC curves (AUC), integrated over FPR ∊ [0, 0.1] for different analysis methods applied to simulated data with different noise levels. (D). ROC curves for different analysis methods applied to simulated data with a noise fraction of 0.85 (SNR = 0.18) which is close to the real fMRI data (dotted red ellipse in (C)). Areas under ROC curves, integrated over FPR ∊ [0, 0.1] for each method are listed in the legend.

