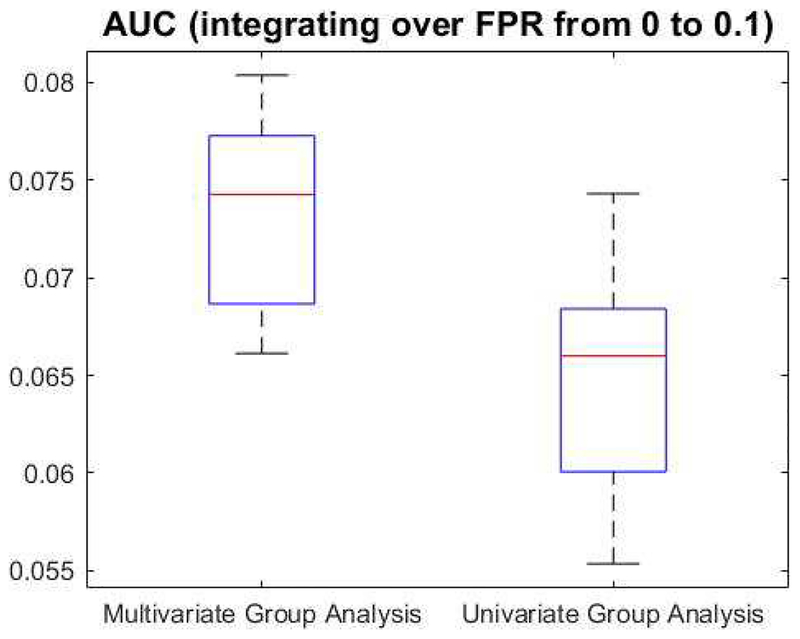
Figure 2.
Significance analysis between multivariate (SV+cCCA) and univariate (SV+SV) group-level analysis methods using simulated data with a noise fraction of 0.85. Areas under the ROC curves (AUCs), integrating over false positive rate (FPR) from 0 to 0.1, are plotted for multivariate (left) and univariate (right) group-level analysis methods. Significant between-group difference is observed (p=0.0023).

