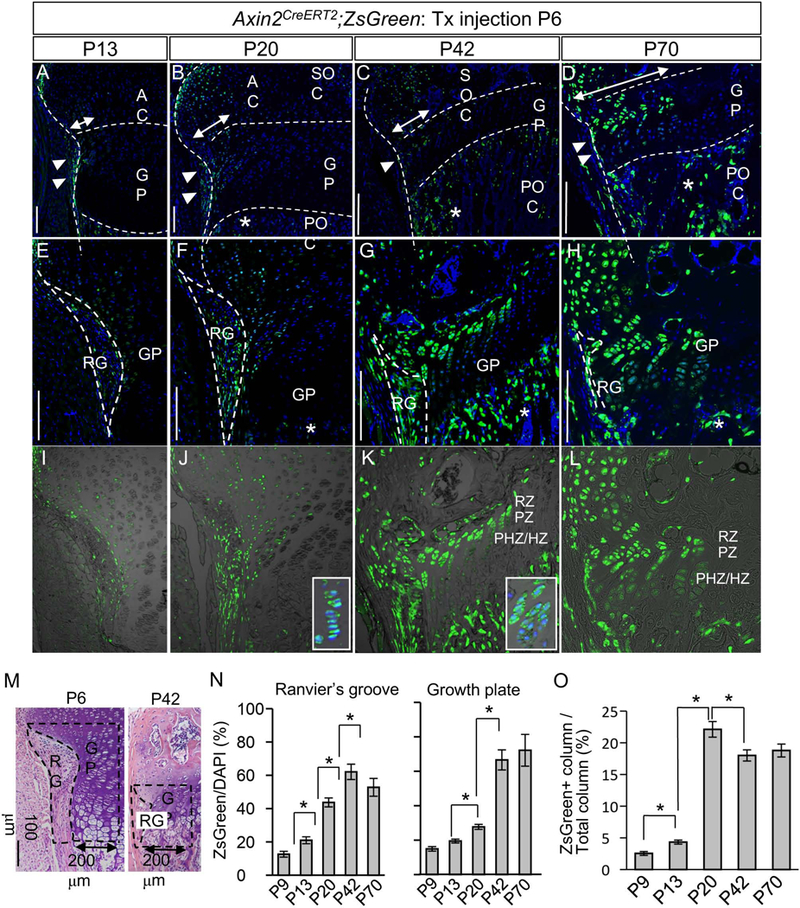
Fig. 2. Fate mapping of Wnt-responsive cells in Ranvier’s groove and growth plate of the tibia during postnatal growth.

Female mice carrying Axin2CreERT2;RosaZsGreen (Axin2CreERT2;ZsG) received a tamoxifen injection at postnatal day 6 (P6). The Ranvier’s groove (RG) and growth plate (GP) of the tibial proximal epiphysis were histologically examined 7 to 64 days post injection (P13 to P70). The images represent the RG and GP of the posterior side of the proximal tibia. (A, E and I) At P13, the number of ZsG+ cells were increased in the epiphyseal cartilage, compare to P9 (Fig. 1A–C). (B, F and J) At P20, the ZsG+ cells were further expanded toward the epiphysis and also evident in GP columns (inset in J). (C, G and K) At P42, the ZsG+ cells constituted the outer columns in the GP (inset in K). (D, H and L) At P70, the ZsG+ cells occupied the epiphysis and outer GP. (A-H) ZsG (green) and DAPI (blue). (I-L) ZsG (green) and DIC. RG, Ranvier’s groove; GP, growth plate; AC, articular cartilage; POC, primary ossification center; Asterisk, ZsG+ cell in POC; RZ, resting zone; PZ, proliferative zone; PHZ/HZ, prehypertrophic and hypertrophic zone. Bar = 100 μm. Representative images of at least five animals per time points are shown. (M) ZsG+ cells were counted in RG (perichondrium adjacent to the growth plate) and GP within 200 μm range adjacent to the RG. Broken lines illustrate the RG and GP examined. (N) The percentage of number of ZsG+ cells to number of DAPI-positive cells in the RG and GP. The values and error bars represent average and standard deviations. *, p < 0.05. (O) The percentage of number of ZsG+ GP columns to number of DAPI-positive GP columns. ZsG+ GP column occupied about 20% outer portion of the GP columns at P20. The values and error bars represent average and standard deviations. *, p < 0.05.
