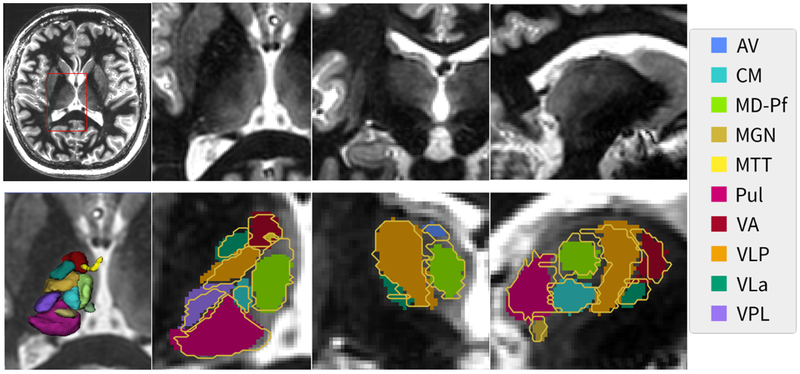
Figure 5.
A representative slice from a WMn MP-RAGE dataset (top left) along with the zoomed insets in three orthogonal planes (top right panels). THOMAS segmentation results (solid color) are shown in the bottom right panels with the manual segmentation shown as yellow outlines. A 3D rendering of the segmentation is shown in the bottom left panel. Note that even small structures like the MTT (yellow) are clearly visualized.

