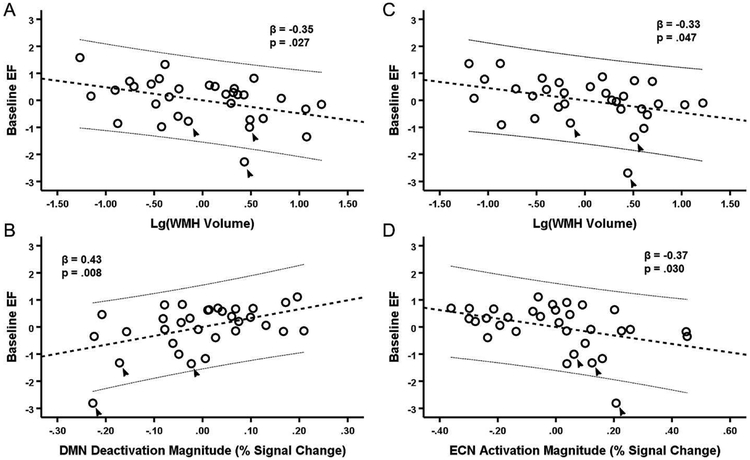
Figure 3. Prediction of EF at Baseline by WMH volume, DMN deactivation, and ECN activation.
A-B: Partial regression plots of baseline EF against WMH volume (A) and DMN deactivation (B) simultaneously. C-D: Partial regression plots of EF against WMH volume (C) and ECN activation (D) simultaneously. A-D: All values are mean-centered. The thick dashed line represents the linear best-fit and thin dashed lines are the 95% confidence interval for the predicted response. Includes all baseline participants (n = 32). The three participants not included in the longitudinal analyses are indicated by arrows.

