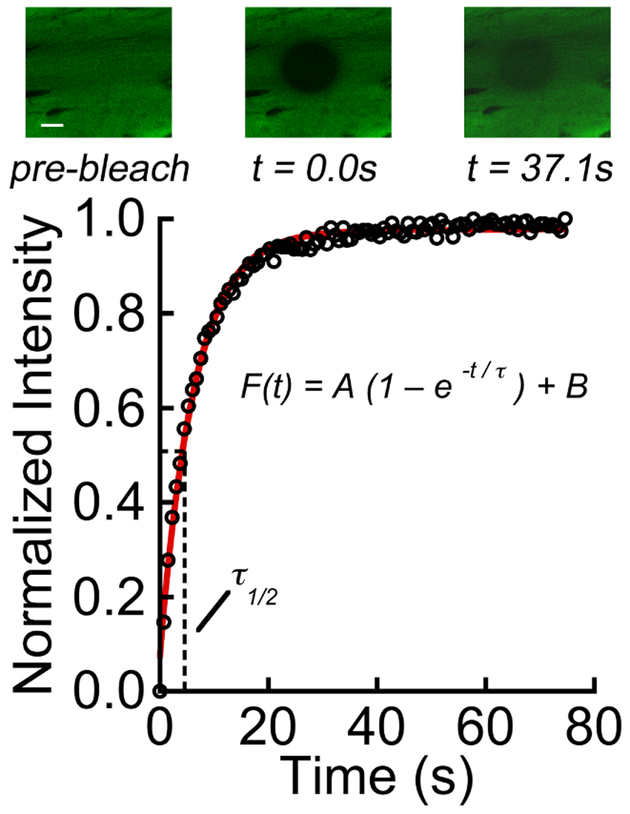
Figure 3:
Upper panel showing photobleaching and fluorescence recovery for CEP tissue. The scale bar indicates 20 μm. Fluorescence intensity in the bleach spot was normalized to pre-bleach intensity, and the resulting normalized intensity values, F(t), were fitted to an exponential recovery curve to determine the time constant of recovery (τ) and recovery half-time (τ½). Solute: sodium fluorescein (376 Da).

