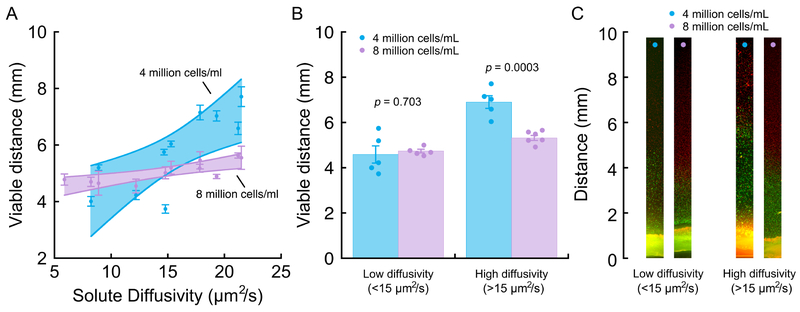
Figure 4:
(A) Viable distance in the diffusion chambers correlated significantly with diffusive transport in the CEPs (determined for sodium fluorescein) at the open sides of the chamber. 4 million cells/mL: for every 1 μm2/s increase in solute diffusivity, there was a 0.24 mm (95% CI: 0.09–0.39 mm, p = 0.006) increase in viable distance (r2 = 0.64, p = 0.006); 8 million cells/mL: for every 1 μm2/s increase in solute diffusivity, there was a 0.06 mm (95% CI: 0.03–0.09 mm, p = 0.003) increase in viable distance (r2 = 0.65, p = 0.003). Error bars denote estimated mean ± SD calculated from 3 viable distance measurements per CEP and per cell density; the validity of the measurements was confirmed in repeat experiments performed using neighboring tissue sections from the same CEP. For the low chamber cell density, data from 10 different CEPs were used to fit the regression. For the high cell density, data from 11 different CEPs were used. Shaded bands display 95% point-wise CI for each relationship. Solute diffusivity measurements represent the mean from 4–6 measurements repeated at various cranial-caudal locations in each CEP. (B) For CEPs with low solute diffusivity, the viable distance in the diffusion chambers was similar for chambers with 4 million cells/mL vs. 8 million cells/mL. For CEPs with high diffusivity, the viable distance was significantly shorter for chambers with 8 million cells/mL. (C) Representative low-magnification photomicrographs of live/dead-stained gels from diffusion chambers in each of the groups in panel (B). The same low-diffusivity CEP or high-diffusivity CEP is shown for each group.

