
Figure 6.
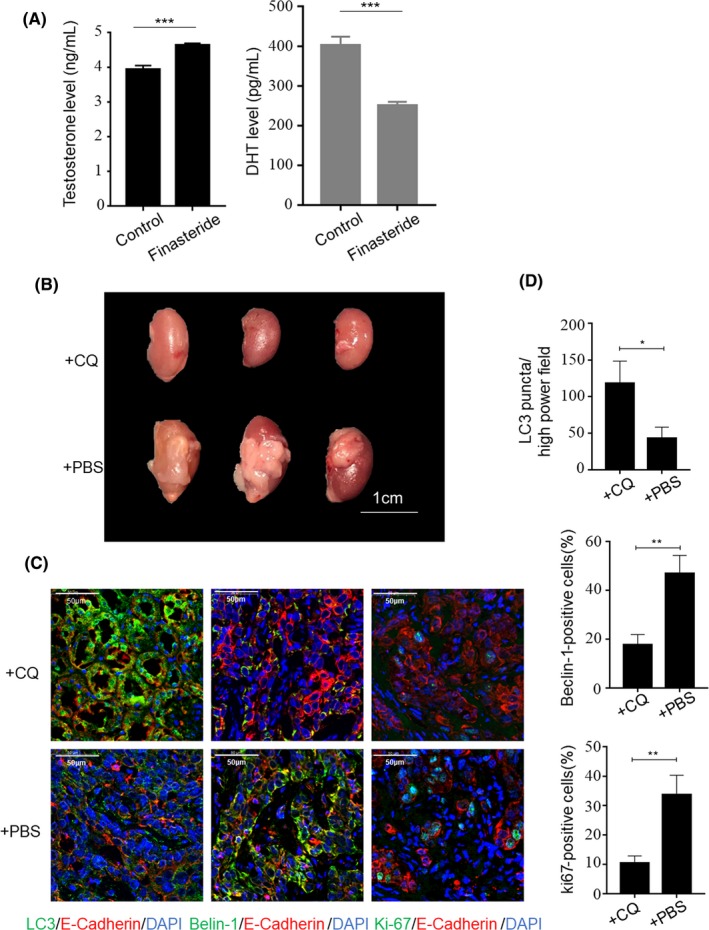
The effect of chloroquine diphosphate on recombinant grafts in vivo. A, Elisa analysis of testosterone and DHT in nude mice serum treated with finasteride for one week. An equal volume of DMSO was used as a control. B, Image of recombinant grafts formed by a mixture of WPMY‐1‐AR and BPH‐1 cells in nude mice. Scale bars, 1 cm. +CQ: chloroquine diphosphate group; +PBS: PBS treatment as the control group. C, Immunofluorescence staining of autophagy and proliferation markers. LC3 (green) was used to verify that the degradation of the autophagosome‐encapsulated contents was blocked by chloroquine. Beclin‐1 (green), autophagy marker; Ki‐67 (green), the proliferation marker. E‐cadherin (red) was used as an epithelium marker to define compartment of recombinant grafts (scale bars, 50 μm). D, Statistical analysis of the number of LC3 puncta, Beclin‐1‐positive and Ki‐67‐positive prostate epithelial cells. *P < 0.05, **P < 0.01