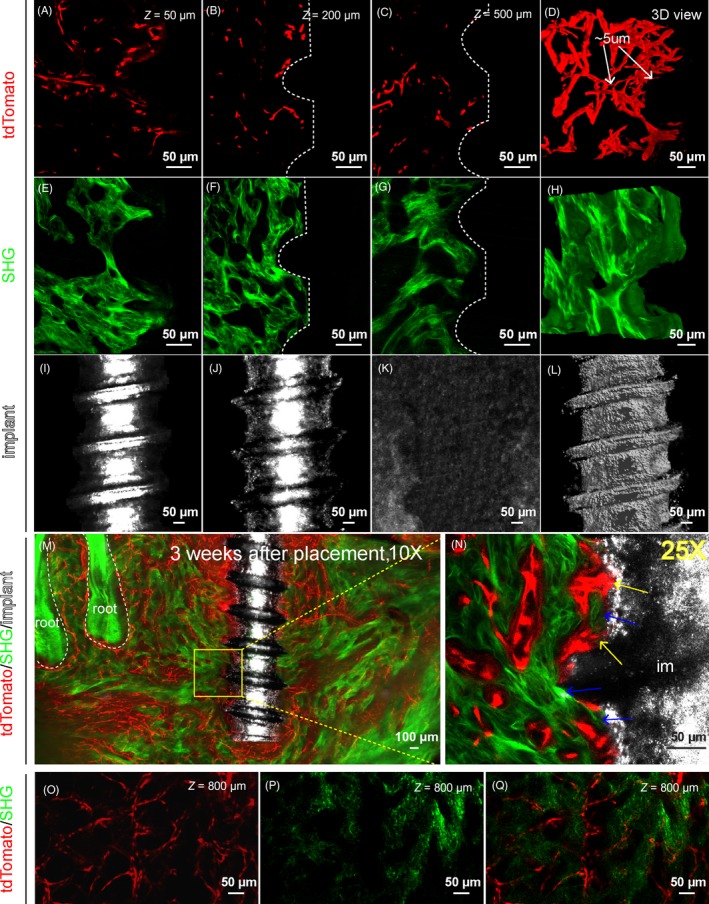
Figure 1.

Polyethylene glycol (PEG)‐associated solvent system (PEGASOS)‐based deep imaging enables multi‐channel imaging of implant‐tissue interface with high resolution. Adult Cdh5‐CreERT2; Ai4 mice (6 wk of age) were used for titanium implant placement. Mandible samples were processed following PEGASOS method with decalcification treatment. Images were acquired with 25× (working distance 0.57 mm) (panels A‐L, N) or 10× (working distance 5.2 mm) (panels M, O, P, Q) objective. A‐C, Optical sections of tdTomato signal displaying blood vessels (tdTomato) near the implant at the depth of 50 μm (A), 200 μm (B) or 500 μm (C). D, 3‐D view of a 150‐μm‐thick optical stack of tdTomato signal displaying blood vessels near the implant. Arrows show capillaries with the diameter of ~5 μm. E‐G, Optical sections of second harmonic generation (SHG) signal displaying bone near implants at the depth of 50 μm (E), 200 μm (F) or 500 μm (G). H, 3‐D view of a 150‐μm‐thick optical stack of SHG signal displaying bone tissue near the implant. I‐K, Optical sections of reflection signal displaying implants at the depth of 50 μm (I), 200 μm (J) or 500 μm (K). No signal was detected at depth of 500 μm (K) because the reflection signal could not pass through the diameter of the implant. L, 3‐D view of a 150‐μm‐thick optical stack of reflection signal showing the implant. M, A 400‐μm‐thick optical stack showing a titanium implant within the mandible bone with surrounding vasculature. N, Optical section of boxed area in (M) was acquired with a 25× objective. Yellow arrows show blood vessels in direct contact with the implant surface. Blue arrows indicate direct bone‐implant contact. O‐Q, Optical sections showing blood vessels (O) and bone (P) at the depth of 800 μm in the mandibular furcation region. Scale bars, 100 μm in panel M, 50 μm in other panels. im, implant
