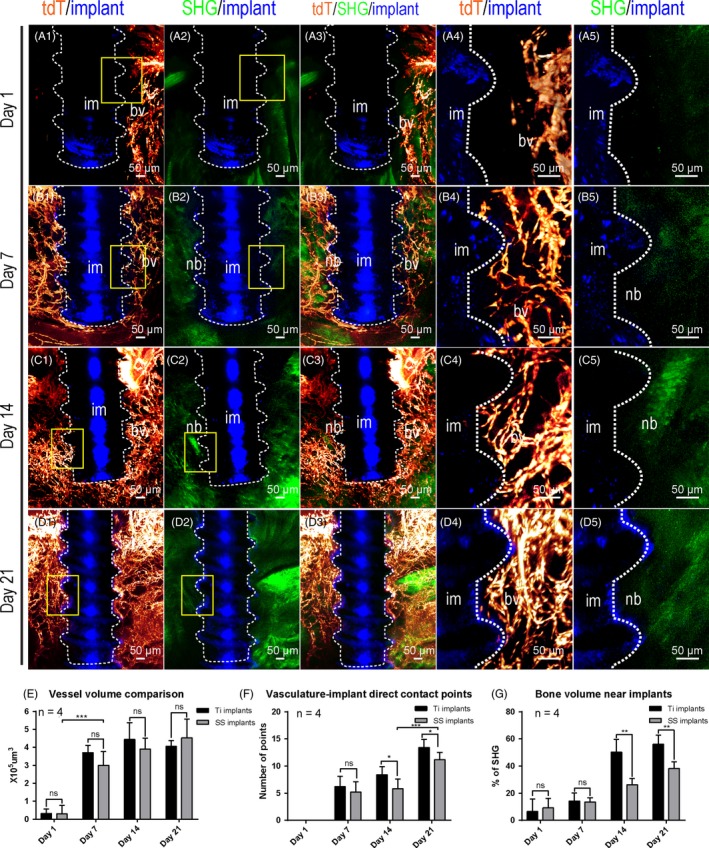
Figure 5.

Three‐dimensional quantitative analysis shows comparable angiogenesis but reduced osteogenesis on the surface of stainless steel implants than on titanium implants surface. Adult Cdh5‐CreERT2; Ai4 mice (2 mo of age) were used for stainless steel implant placement. Samples with stainless steel implants were cleared with decalcified polyethylene glycol (PEG)‐associated solvent system method and imaged in the same way as for the titanium implants. Optical stacks of 150 μm thickness were acquired to demonstrate blood vessels (tdTomato, red) surrounding the interface between implant (reflection image, blue) and mandible bone (second harmonic generation, green). (A1‐A3) Images were acquired with 10× objective 1 d after implant placement. A4‐A5, Boxed areas in A1 and A2 were re‐imaged with a 25× objective. B1‐B3, Images were acquired with 10× objective 1 wk after implant placement. B4‐B5, Boxed areas in B1 and B2 were re‐imaged with a 25× objective. C1‐C3, Images were acquired with 10× objective 2 wk after implant placement. C4‐C5, Boxed areas in C1 and C2 were re‐imaged with a 25× objective. D1‐D3, Images were acquired with 10× objective 3 wk after implant placement. D4‐D5, Boxed areas in D1 and D2 were re‐imaged with a 25× objective. E, Comparison of total blood vessel volumes around Ti and SS implants at different time points. The quantification results for Ti implants were from Figure 2. n = 4. F, Comparison of percentiles of bone matrix volume near Ti and SS implants at different time points. n = 4. G, Comparison of number of direct contact points between the implant and blood vessels at different time points. n = 4. Scale bars, 100 μm. bv, blood vessels; im, implant; nb, new bone
