
Figure 1.
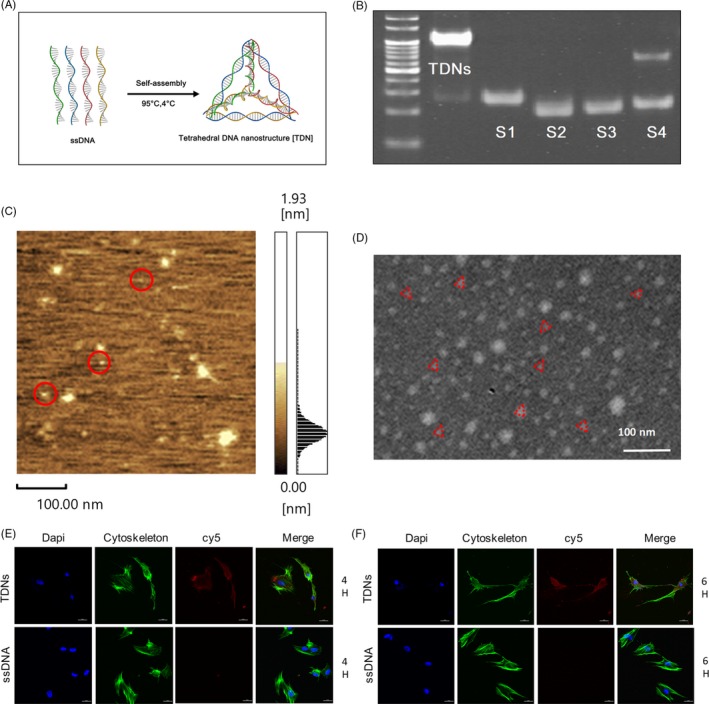
Characterization of TDNs. A, The composition diagram of TDN. B, The result of 8% PAEG. C, The scanning image of TDN by AFM. D, The scanning image of TDN by TEM. Scale bars are 100 nm. E, After treatment with TDNs for 4 h, the ability of TDN to enter PDLSCs without the assistance of vectors was analysed by immunofluorescence staining. (nucleus: blue, cytoskeleton: green, cy5: red). Scale bars are 25 µm. F, After treatment with TDNs for 6 h, the ability of TDN to enter PDLSCs without the assistance of vectors was analysed by immunofluorescence staining. (nucleus: blue, cytoskeleton: green, cy5: red). Scale bars are 25 µm.