
Figure 2.
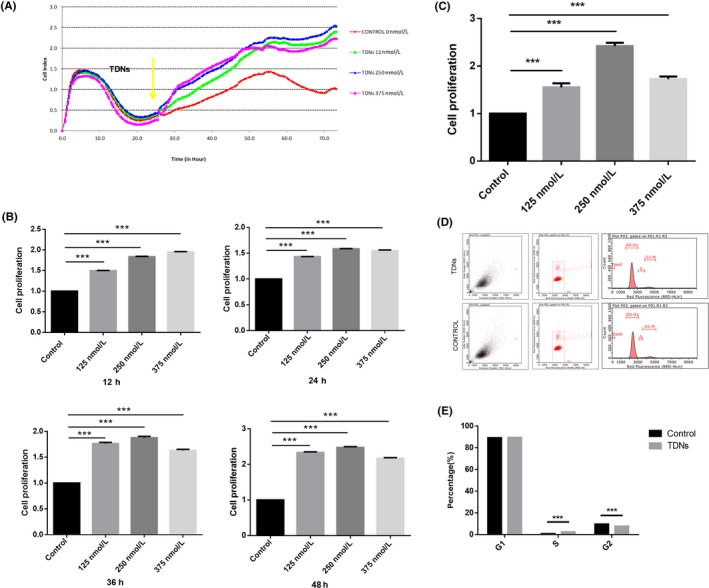
Effect of TDNs on proliferation. A, The proliferation of PDLSCs was observed by RTCA. B, Statistical analysis of RTCA results in 12, 24, 36 and 48 h. C, Statistical analysis of CCK8 results. Data are presented as means ±standard deviations (n = 3). ***P < 0.001. D, Flow cytometry was used to explore the role of TDNs on the PDLSCs by detecting cell cycle changes. E, Statistical analysis of cell cycle distribution. Data are presented as means ±standard deviations (n = 3). ***P < 0.001.