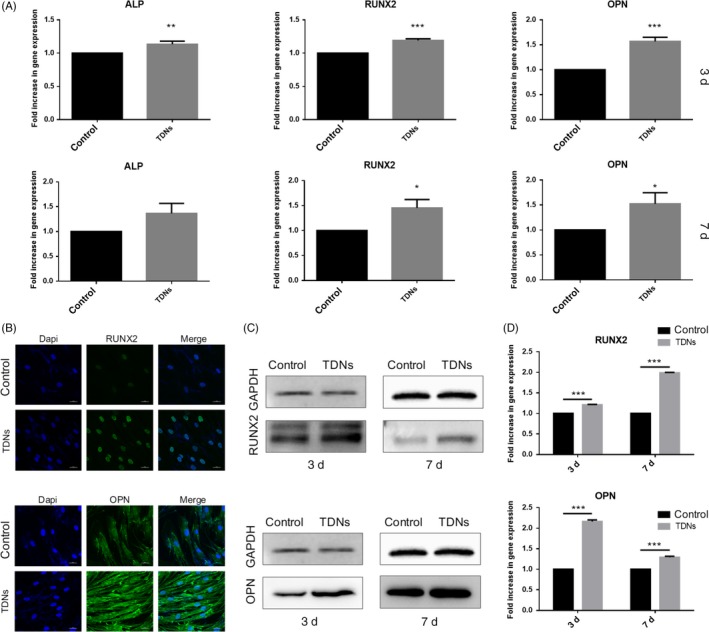
Figure 3.

Effect of TDNs on osteogenic differentiation in PDLSCs. A, The quantitative analysis results of gene expression obtained by RT‐PCR. Data are presented as means ± standard deviations (n = 3). *P < 0.05, **P < 0.01, ***P < 0.001. B, Immunofluorescent micrographs of RUNX 2 protein and OPN protein. (nucleus: blue, RUNX 2 protein and OPN protein: green). Scale bars are 25 µm. C, The results of RUNX 2 and OPN proteins expression measured by WB. D, Statistical analysis of WB. Data are presented as means ± standard deviations (n = 3). ***P < 0.001.
