
Figure 1.
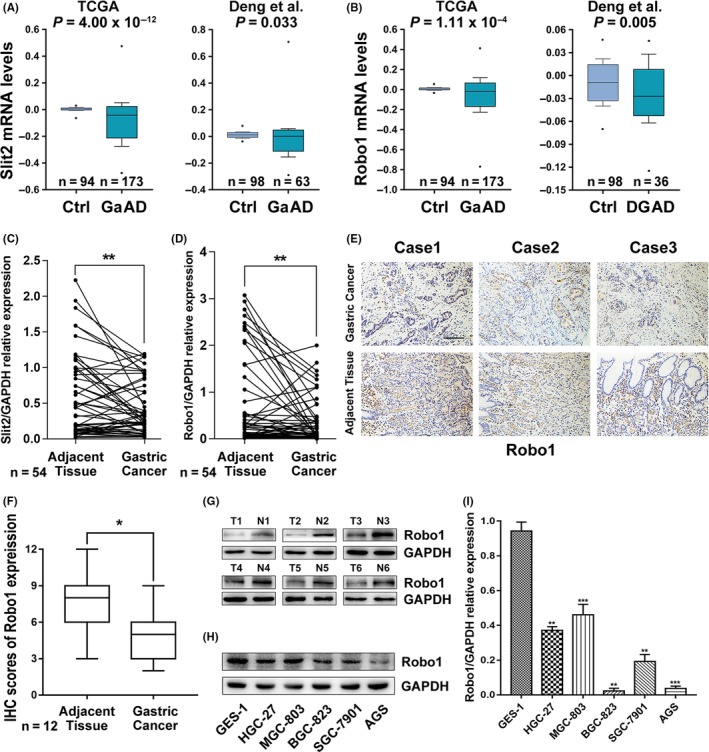
Expression of Slit2 and Robo1 is down‐regulated in gastric cancer. (A and B) Slit2 expression and Robo1 expression were analysed in TCGA and Deng's datasets from Oncomine (http://www.oncomine.org). Box and whisker plots: line represents the median value, boxes show 25th and 75th percentiles, whiskers mean 10th and 90th percentiles and the dots indicate maximum and minimum values. P‐values were calculated from Oncomine software using Student's t test. Ctrl, control gastric tissues; GaAD, gastric adenocarcinoma; DGAD, diffuse gastric adenocarcinoma. (C) Slit2 mRNA expression in 54 paired GC and adjacent tissues analysed by qRT‐PCR. (D) Robo1 mRNA expression in 54 paired GC and adjacent tissues analysed by qRT‐PCR. (E) Representative images of immunohistochemical (IHC) staining of Robo1 in 12 paired GC and adjacent tissues. Original magnification, 200×; scale bar: 100 µm. (F) Box plots showing the IHC scores for Robo1 protein expression, analysed by Mann‐Whitney U test. (G) Robo1 protein levels in 6 random paired GC and adjacent tissues determined by Western blotting. (H) Robo1 protein expression in 5 gastric cell lines and the normal human gastric epithelial cell line GES‐1 detected by Western blotting. (I) Robo1 mRNA expression in 5 gastric cell lines and the normal human gastric epithelial cell line GES‐1 detected by qRT‐PCR