
Figure 5.
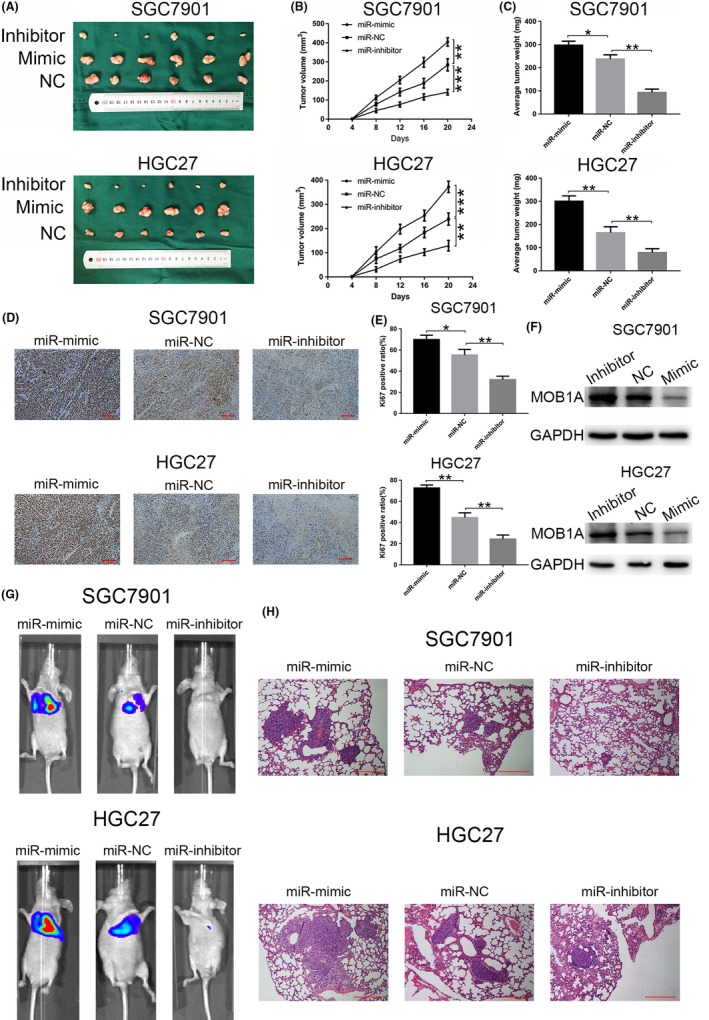
miR‐664a‐3p promotes metastasis of GC in vivo. A, photographs of tumors obtained from mice in miR 664a‐3p mimic and inhibitor groups. B,C, tumor volume and weight were calculated in miR‐664a‐3p mimic and inhibitor groups in SGC7901 and HGC27. D,E, Ki67 staining assay was used to further verify that miR‐664a‐3p promoted tumorigenicity. The Ki67 positive ratio was higher in miR‐664a‐3p mimic group, while the opposite trend was shown in miR‐664a‐3p inhibitor group compared with that in miR‐NC group. F, Western blot assay of tumor in mice indicated significant downregulation of MOB1A expression in miR‐664a‐3p mimic group, which was contrast in miR‐664a‐3p inhibitor group. *P < 0.05, **P < 0.01, ***P < 0.001. The data expressed as the mean ± SD. G, Representative photographs of tumors were taken by the IVIS Imaging System in different groups. H, Representative H&E‐stained sections of lung from mice in different groups.