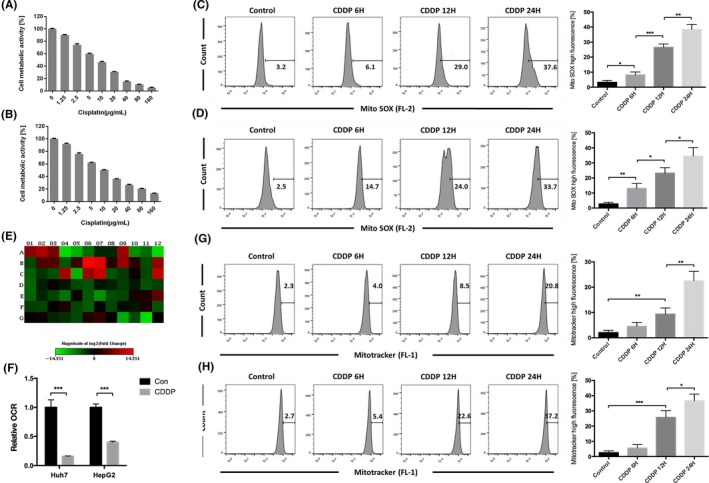
Figure 1.

Mitochondria were an important target of cisplatin in HCC cells. A, Huh7 and B, HepG2 cells were treated with varying doses of cisplatin for 24 h. Cell metabolic activity was determined using the MTT assay and expressed as the mean ± SD; n = 3. C, Huh7 cells were treated with 8 μg/mL cisplatin, and D, HepG2 cells were treated with 12 μg/mL cisplatin for varying durations and stained with MitoSOX Red and then detected using flow cytometry. The percentage of cells with high MitoSOX fluorescence is expressed as the mean ± SD; n = 3, *P < 0.05, **P < 0.01, ***P < 0.001. E, Huh7 cells were incubated with 8 μg/mL cisplatin for 8 h and examined using a PCR array. For details regarding gene names, see Supporting Information Table S1. Changes are presented as a heatmap; green indicates downregulation, and red indicates upregulation. Data were derived from three experiments. F, OCR was measured after Huh7 cells were treated with 8 μg/mL cisplatin and HepG2 cells were treated with 12 μg/mL cisplatin. Relative OCR values are expressed as the mean ± SD; n = 3, ***P < 0.001. G, Huh7 cells were treated with 8 μg/mL cisplatin and H, HepG2 cells were treated with 12 μg/mL cisplatin for varying durations. Then, the cells were stained with MitoTracker Green FM and detected using flow cytometry. The percentage of cells with high MitoTracker fluorescence is expressed as the mean ± SD; n = 3, *P < 0.05, **P < 0.01, ***P < 0.001
