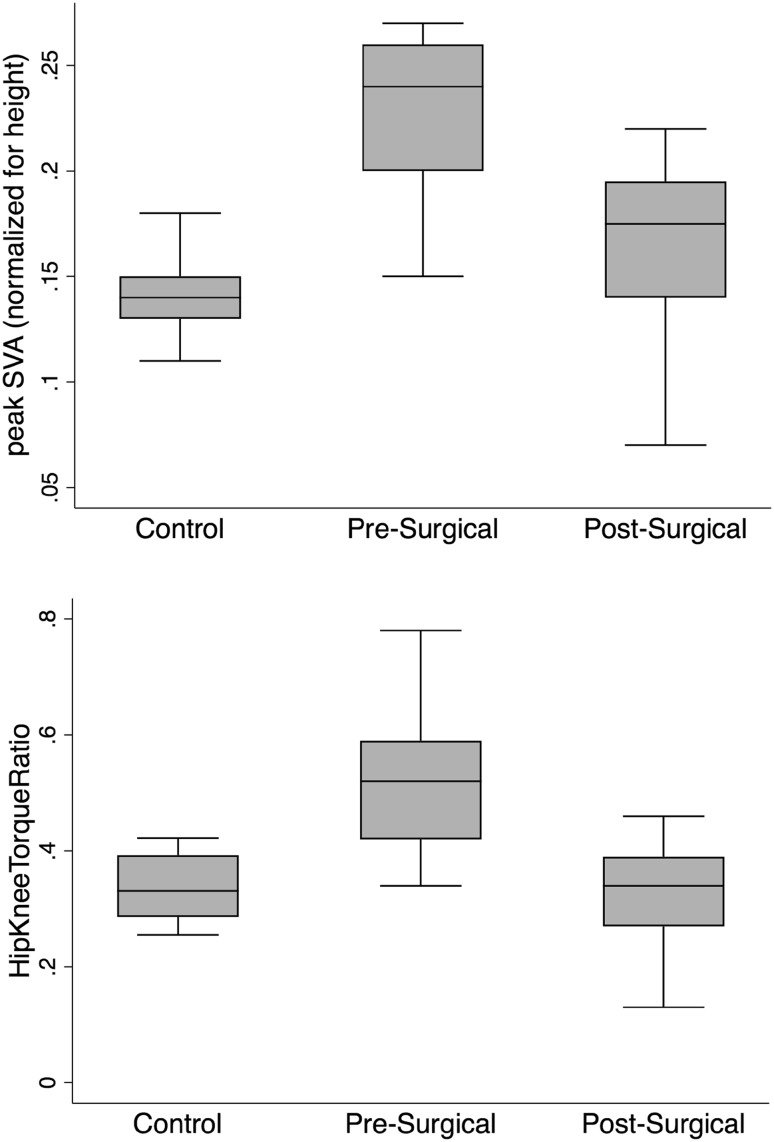
Fig. 2.
Box plots for group comparison in peak SVA and hip/knee torque ratio. Both peak SVA and hip/knee torque ratio significantly decrease between pre- and post-surgery time points. For peak SVA, post-surgical is 28% lower than pre-surgical (p < 0.001). For hip/knee torque ratio, post-surgical is 19% points lower than pre-surgical (p < 0.001). Both metrics were significantly higher for the pre-surgical data compared to the controls, but the post-surgical data did not differ from the controls, showing improvement for the surgical patients

