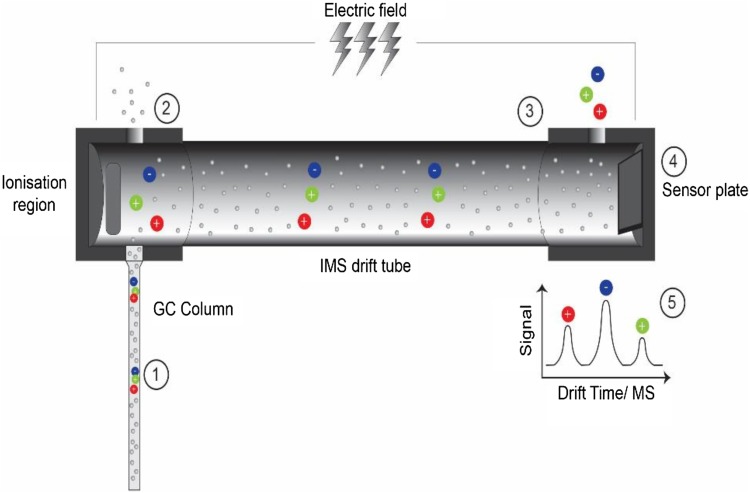
Fig. 1.
Schematic of the separation process and ion detection using gas chromatography–ion mobility spectrometry (GC–IMS). (1) Sample passes through the gas column where initial separation occurs. (2) The discrete compounds are consecutively fed into the ionisation chamber where ionisation occurs. (3) Ions pass through the drift tube at varying speeds dependent on their mobility. (4) Ions hit the sensor plate and are detected. (5) Ion peaks are calculated based on drift time

