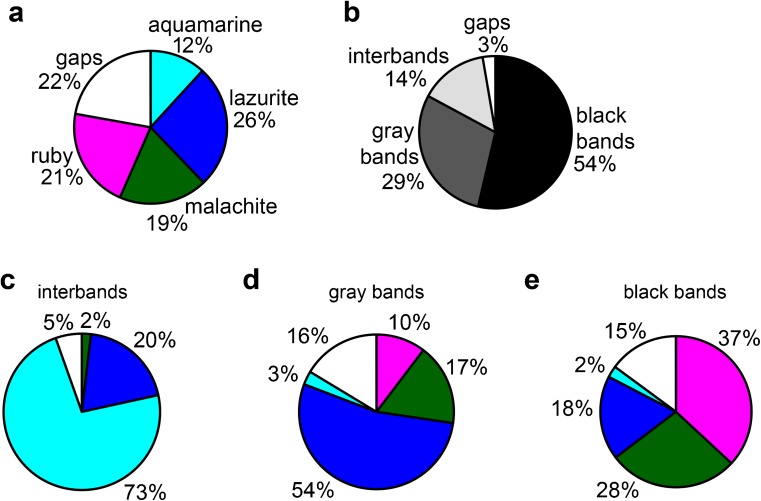
Fig. 2.
Chromatin and morphological composition of the fourth chromosome. a The percentage of the four chromatin types in the dot chromosome. Here and further, colors on the diagram correspond to chromatin types and white section corresponds to gaps, where the four-chromatin-state model failed to return a specific value. b The percentage of bands and interbands in the dot chromosome. Here and further, colors on the diagram correspond to morphological structures and white section corresponds to gaps, which were not included in bands or interbands. c Chromatin composition of the fourth chromosome interbands. d Chromatin composition of the fourth chromosome gray bands. e Chromatin composition of the fourth chromosome black bands

