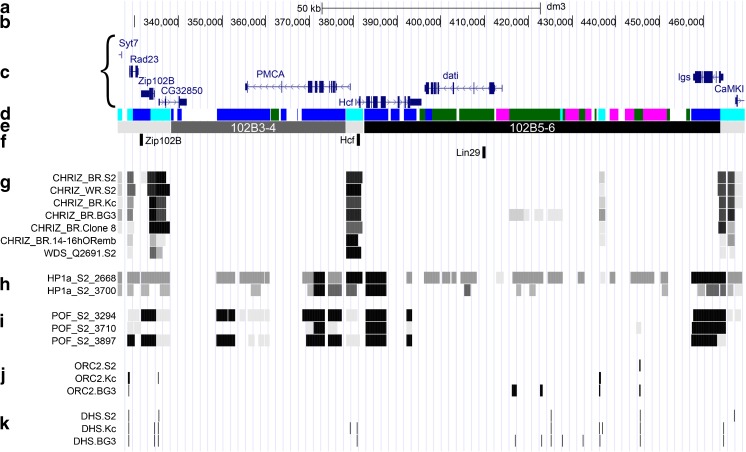
Fig. 5.
Molecular, genetic, and cytological organization of the fourth chromosome 102В3-4–102В5-6 site: a the scale (kb); b the genomic coordinates (bp); c the genes (denoted by a curly bracket); d the four-chromatin-state model; the colors correspond to the type names (Zhimulev et al. 2014; Boldyreva et al. 2017); e the scheme of band and interband localization relative to the genomic coordinates. The band names are denoted. The black ruby-containing bands are shown in black rectangles, the gray bands are shown in dark gray rectangles, and the interbands are shown in light gray rectangles. f FISH probes; g CHRIZ and WDS open chromatin protein localization in different cell types (modENCODE data); h HP1a protein localization in S2 cells (modENCODE data); i POF protein localization in S2 cells (modENCODE data); j ORC2 protein localization in different cell types (Eaton et al. 2011); k DNaseI hypersensitive sites (DHS) localization (Kharchenko et al. 2011)

