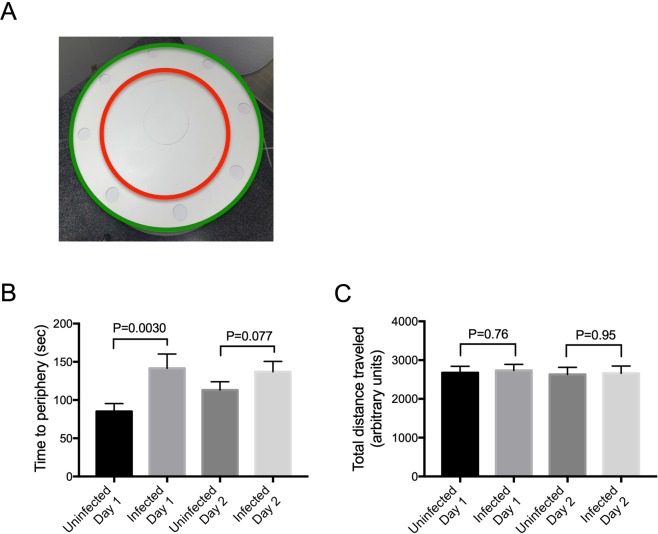
Figure 4.
Activity Task. (A) Experimental set-up for Activity Task. Hamsters were placed in the center of a round table within a closed room. The hamsters were allowed to explore the table for 10 minutes and the entire task was recorded for later scoring. The task was repeated on a second day. The time each hamster took to go from the center to the border of Central (C) and Peripheral (P) zones and the total distance traveled was calculated from recordings. The green and red circles were not present during hamster testing but were added by computer during image analyses. (B) Time to get to the Peripheral zone. The amount of time in seconds it took for a hamster to go from starting point (center of the table) to the boundary between Central and Peripheral zones was determined and plotted for each day. On day 1, but not day 2, infected animals took longer to reach the periphery (P = 0.0030). (C) Uninfected and infected hamsters traveled similar distance in the Activity task. Total distance (arbitrary units) traveled within both Central and Peripheral zones were recorded and calculated. There was no difference in distance traveled between infected and uninfected hamsters on either day.

