Figure 5.

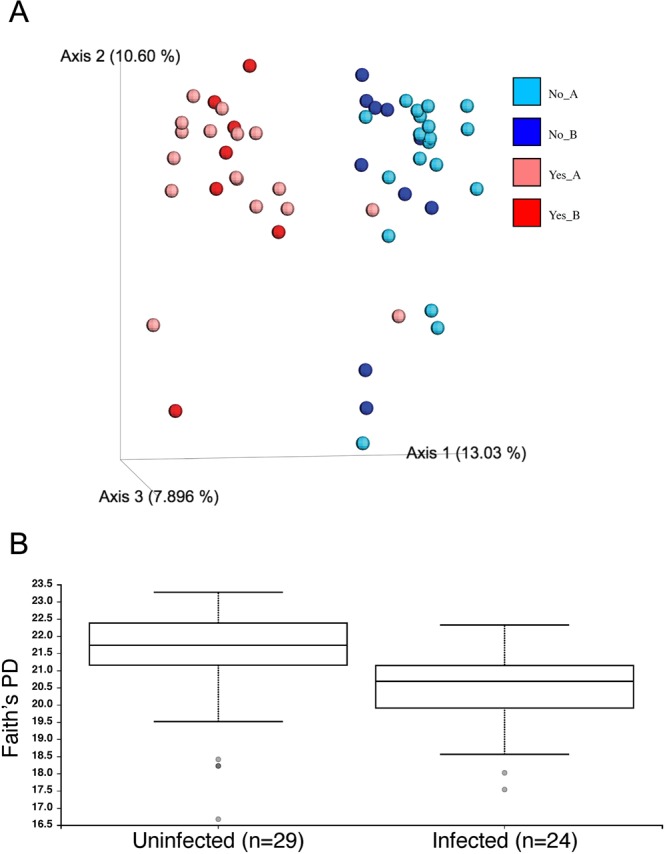
Microbiome analyses of hookworm-infected hamsters. (A) Beta-diversity between hookworm-infected and uninfected hamsters. Principal Coordinate analysis of beta-diversity between samples is presented as calculated in QIIME2:2018.4. The unweighted unifrac metric was used to calculate distances between samples. The percent of total variation explained by each PCoA axis is given in parentheses. Red tones = infected; blue tones = uninfected. Experiments A and B are shown separately for each. Each dot represents an individual sample. (B) Alpha-diversity between hookworm-infected and uninfected hamsters. Alpha diversity analysis using Faith’s Phylogenetic Diversity (PD) as calculated in QIIME2:2018.4. Boxes indicate the 25th and 75th percentiles (first and third quartiles) for uninfected (left) and infected (right) hamsters. The horizontal line within the box denotes the median. Whiskers show the range of the data excluding outliers (which are shown as gray dots) that fell more than 1.5 times the interquartile range.
