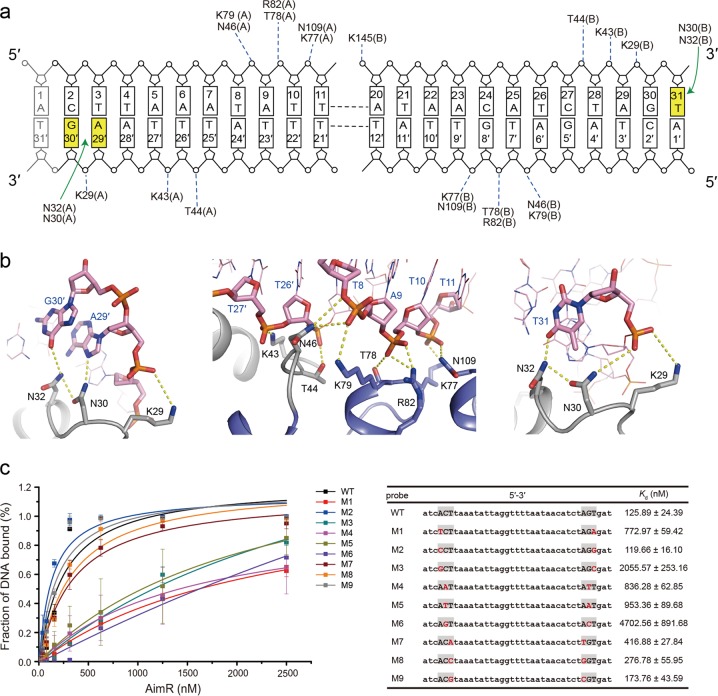
Fig. 2. DNA recognition by the AimR protein.
a Schematic view of AimR–DNA contacts. The bases are labeled according to the symmetry of the DNA sequence. Hydrophobic contacts are shown as green arrows, while nonspecific interactions are indicated by blue dotted lines. b Key residues and nucleotides involved in the interactions. Protein side chains and DNA bases are shown in a stick representation. DNA phosphate backbones and bases are colored orange and pink, respectively. c Examination of the DNA-binding affinity of AimR toward various DNA. The DNA sequence of each probe and the respective Kd values are listed in the table. The varied nucleotides are highlighted in red. Error bars indicate the s.d. of at least three independent measurements (the points are the mean)

