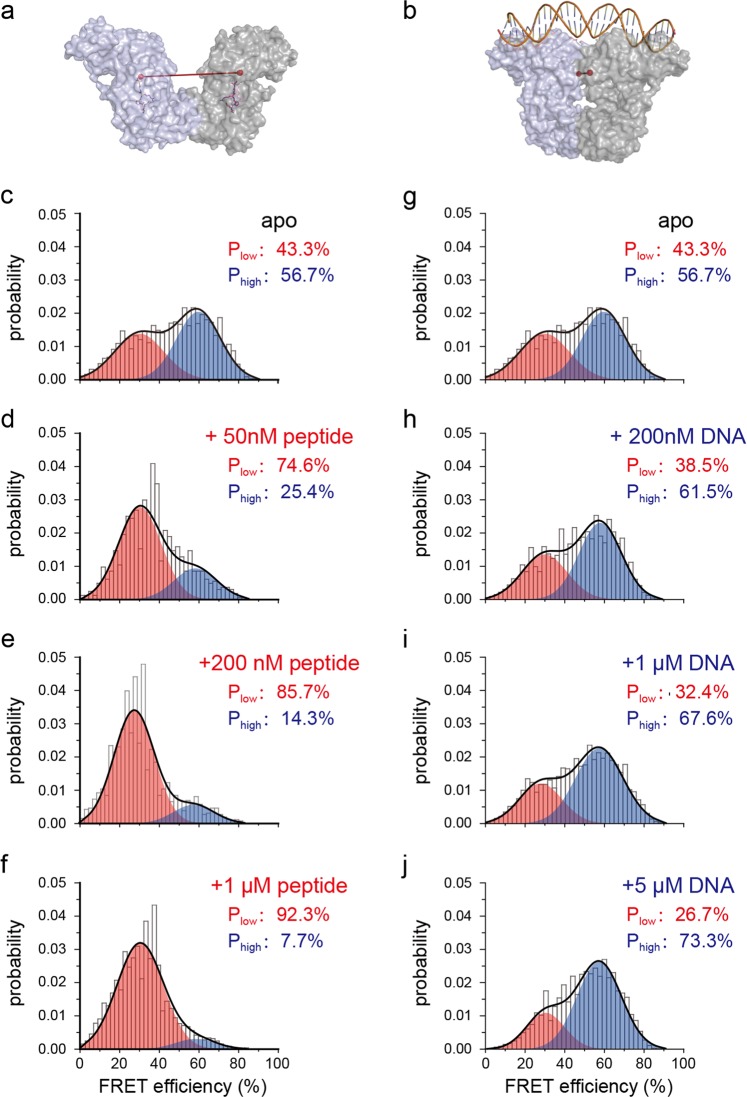
Fig. 5. AimR adopts two conformational states for targets selectively recognition.
a, b The distance between the fluorophores labeling sites in the peptide-bound AimR (red line) is longer than that in the DNA bound AimR (blue line), indicating low- and high-FRET efficiency, respectively. The Ca atoms of the Val129 are shown as red spheres, the peptide and the DNA are shown as sticks. c, g The smFRET profile (gray histogram) of AimR can be fitted as the sum of the two FRET species (black line). The low- and high-FRET species are colored red and blue, respectively. The arbitrium peptide selectively enriches the low-FRET species (d–f), and the DNA selectively enriches the high-FRET species (h–j). The FRET efficiency centers change little upon the ligand titrations. Note that panels (c) and (g) are identical in order to convenient tracking the population changes upon peptide or DNA binding

