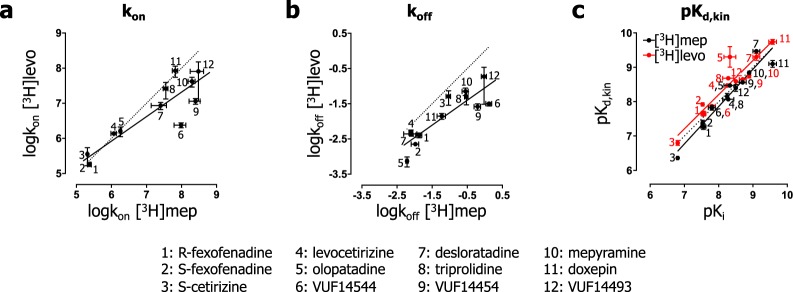
Figure 5.
Comparison of the binding properties of unlabeled ligands as measured by using two different probes at 25 °C. Binding rate constants of unlabeled ligands were determined in radioligand binding studies. A correlation plot is depicted for the logkon (a) and logkoff (b) as determined from competitive association experiments using either [3H]mepyramine (x-axis) or [3H]levocetirizine (y-axis) as competitive probe. (c) The correlation plot between the affinity calculated from the kinetic binding rate constants (pKd,kin) and the affinity from competition binding experiments (pKi) is depicted. Errors represent SEM values. Dashed lines represent a perfect correlation respective to the X-axis values and solid lines represent the linear regression lines.

