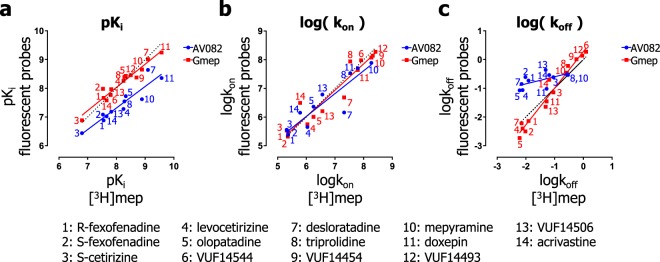
Figure 8.
Comparison of the binding properties of unlabeled ligands as measured by using orthogonal assays at 25 °C. The binding rate constants of unlabeled ligands that were determined using the fluorescent probes AV082 and Gmep were compared with the binding constants obtained with [3H]mepyramine. A comparison of the pKi values (a) (from equilibrium competition binding experiments) is depicted as well as the comparison of kon (b) and koff (c) values (from kinetic competition association experiments). Dashes lines represent a perfect correlation respective to the X-axis values and solid lines represent the linear regression lines.

