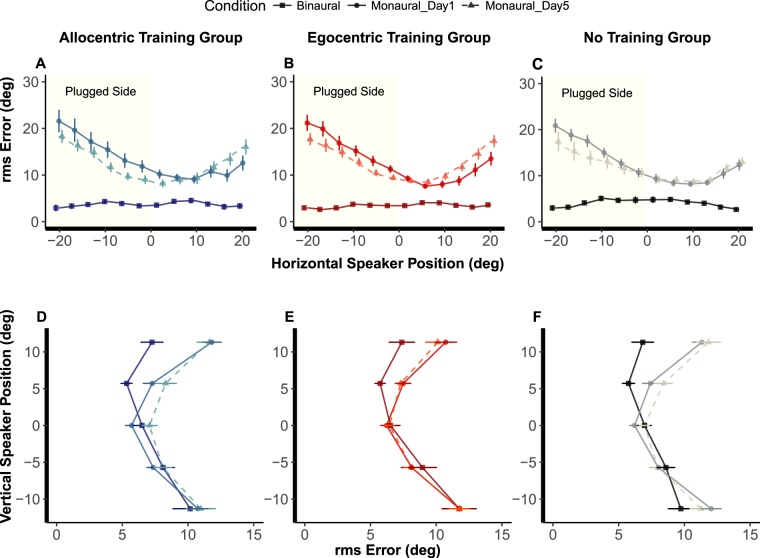
Figure 2.
Performance in the sound localisation test. Rms errors for each listening condition (binaural, monaural day 1 and monaural day 5; for clarity performance on day 3 is not shown, see Table 1S and 2S for mean values) are displayed as a function of speaker position, separately for each group, for azimuth (A–C) and elevation (D–F). Thicker axes highlight horizontal speaker position (A–C) and vertical speaker position (D–F), respectively. Error bars show the standard error.

