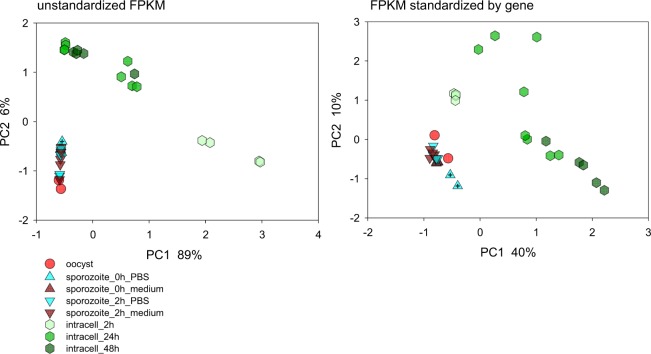
Figure 1.
Principal Component Analysis of 35 Cryptosporidium parvum transcriptomes. The analysis is based on raw FPKM values for 3885 annotated C. parvum genes (left) and FPKM values normalized by gene (right). Included in the analysis are two oocyst samples (red circles), 16 sporozoite samples incubated in medium (brown) or PBS (turquoise) for 0 (triangle up) or 2 h (triangle down) as indicated in the key. Infected cells (hexagons) were analyzed at 2 h, 24 h and 48 h post-infection, as indicated by light, medium and dark green symbols, respectively. Crossed triangles indicate samples 1 H and 2 H (Table 1).

