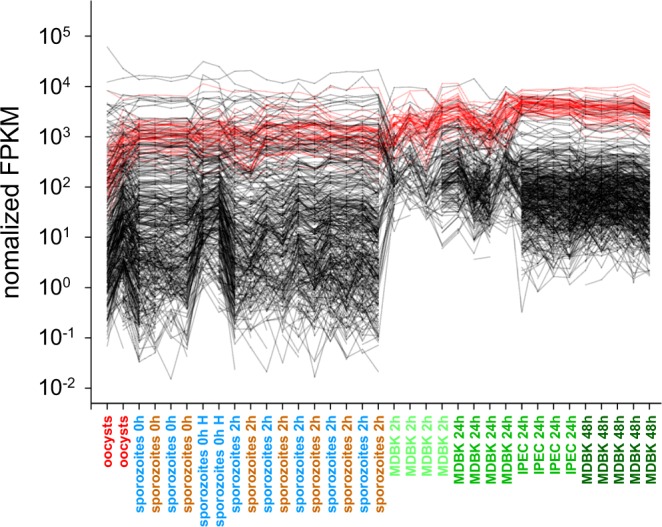
Figure 4.

Upregulation of genes encoding ribosomal biosynthesis functions following host cell invasion. Normalized FPKM values of 55 genes encoding ribosomal proteins (red) and 455 randomly chosen genes encoding other functions (black) reveal an upregulation of ribosomal protein expression in relation to other functions. Life cycle stages are ordered on the x axis first in temporal order and second by experiment. The position of replicate samples within each group is arbitrary. The samples are color-coded as in Figs 1 and 2.
