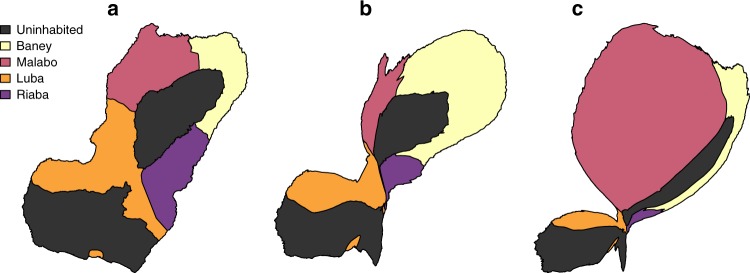
Fig. 3.
Cartograms of Bioko Island illustrating within-island destinations. Areas were distorted in proportion to the number of within-island travelers bound to each destination district (Table 2). a The administrative units of Bioko Island are shown with their correct shape and size, for comparison. b, c The destinations of those who traveled from Malabo and of those traveling from all other districts are illustrated as cartograms, respectively. Each cartogram was produced using 10 iterations. Source data are provided as a Source Data file

