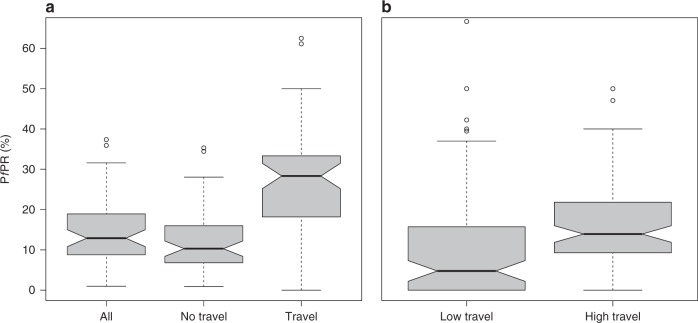
Fig. 4.
Distribution of observed PfPR across map-areas according to history of travel. a PfPR in all individuals and in those with and without history of off-island travel. b Distribution of PfPR across map-areas with low and high levels of off-island travel, after excluding travelers. The cutoff was determined by the median travel prevalence for all map-areas (see text). The thick black lines and notches in the boxes represent the medians and associated 95% confidence intervals; the box limits represent the interquartile range; the minimum and maximum values are given by the horizontal lines at the end of the whiskers and outliers, or data points that are lower or greater than the first and third quartile by 1.5 times the interquartile range, are represented by the empty circles. Source data are provided as a Source Data file

