Figure 4.
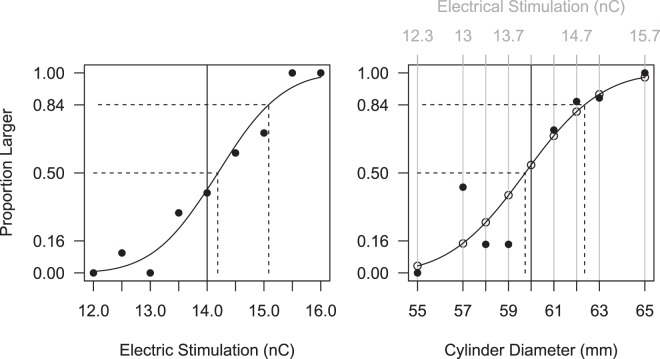
From cylinder diameter to neural stimulation. Left: Electrical stimulation discrimination experiment. On the x-axis, the electrical stimulation injected for the comparison stimulus (in nC). On the y-axis, the proportions of trials where the comparison stimulus (horizontal axis) appeared larger than the standard (vertical solid line). Black dots corresponds to the data points. Each stimulus was presented 10 times (N = 90). The psychometric function (solid curve) represent the probability of judging the comparison stimulus to be larger than the standard. The horizontal distance between the two dashed lines corresponds to the JND. Right: Mapping between the electrical stimulation and the stimuli size. The grey scale above the top margin indicates the charges used in the main experiment as artificial somatosensory stimuli. Black dots correspond to data points and empty dots indicate the probability of judging the comparison stimulus (horizontal axis) larger than the standard (vertical line) for the different stimulation levels (grey scale).

