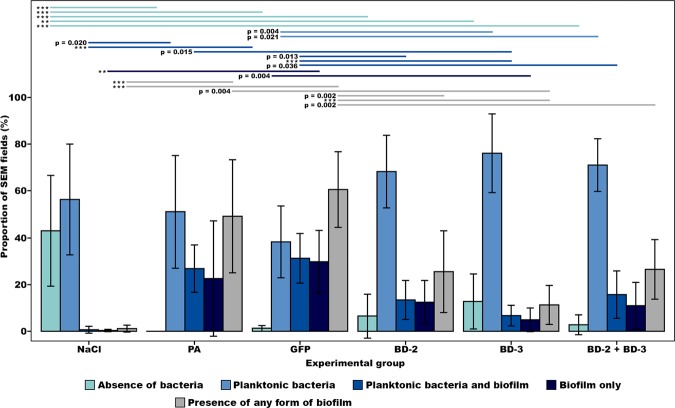
Figure 10.
Bar graphs representing the proportion of scanning electron microscopy (SEM) fields in the different experimental groups with no bacteria, with planktonic bacteria, with both planktonic bacteria and biofilm, and only with biofilm. For each rat, observations were made on 20 random SEM fields at 7500X magnification on each of the two catheter segments, or, when only one catheter segment could be retrieved, on 40 random SEM fields of that catheter segment. Horizontal lines in the upper portion of the figure indicate statistically significant differences between groups (p < 0.05). Error bars indicate 95% confidence intervals. **p < 0.01, ***p < 0.001.

