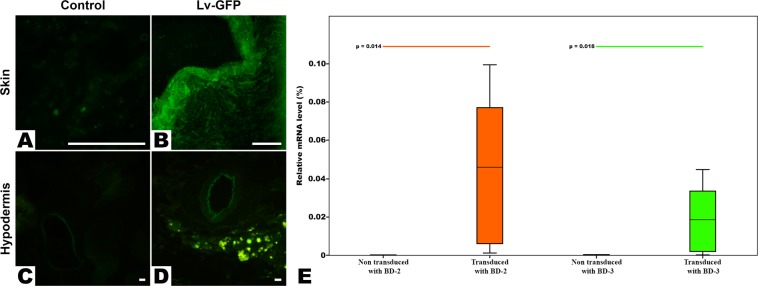
Figure 4.
Confirmation of flap transduction. (A to D) Typical fluorescence image photographs of the skin and hypodermis of the flap of a rat transduced with a Green Fluorescent Protein coding lentivirus (LV-GFP) and those of the flap of a non-transduced rat (Control) seven days after surgery. These photographs demonstrate transduction of flaps by the virus. Calibration bar = 100 µm (E). Analysis of the BD-2 and BD-3 mRNA expression in rat flaps. Box plots represent the relative mRNA expression level of human β-defensins 2 and 3 (BD-2 and 3) analyzed in transduced flaps (BD-2, BD-3 and BD-2 + BD-3) compared to non-transduced flaps on the seventh post-operative day relatively to the expression of the β-actin in these flaps using real-time PCR. The relative mRNA levels of each gene are expressed as the percentage of the β-actin mRNA levels. Flaps transduced with BD-2 include the BD-2 and the BD-2 + BD-3 groups. Similarly, flaps transduced with BD-3 include the BD-3 and the BD-2 + BD-3 groups. Horizontal lines in the upper portion of the figure indicate statistically significant differences between groups (p < 0.05).

