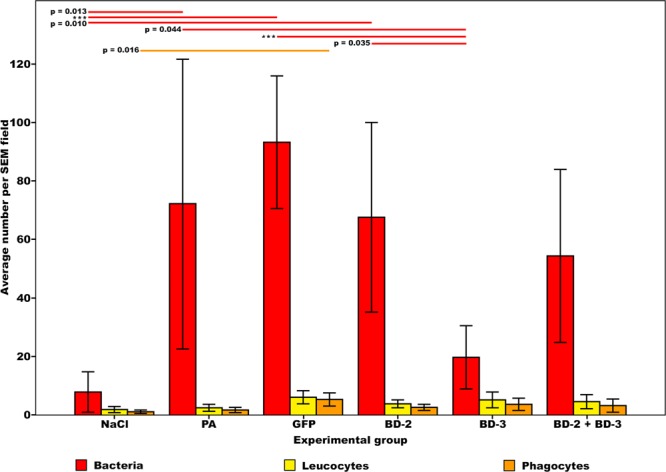
Figure 7.

Bar graphs representing the average number of bacteria, leucocytes and phagocytes on the surface of the catheter segments placed underneath the flaps per scanning electron microscopy (SEM) field. For each rat, the average number of bacteria on the surface of catheters was based on manual counting bacterial cells on 20 SEM fields at 7500X magnification on each of the two catheter segments, or, when only one catheter segment could be retrieved, on counts performed on 40 SEM fields of that catheter segment. Average leucocyte and phagocyte density on the surface of the catheter was performed in a similar way, with the exception that SEM fields used were at obtained 750X magnification. A scanning electron microscope JEOL JSM-5410, with acceleration voltage of 0.015–0.030 V, was used for quantification purposes. Horizontal lines in the upper portion of the figure indicate statistically significant differences between groups (p < 0.05). Error bars indicate 95% confidence intervals. ***p < 0.001.
