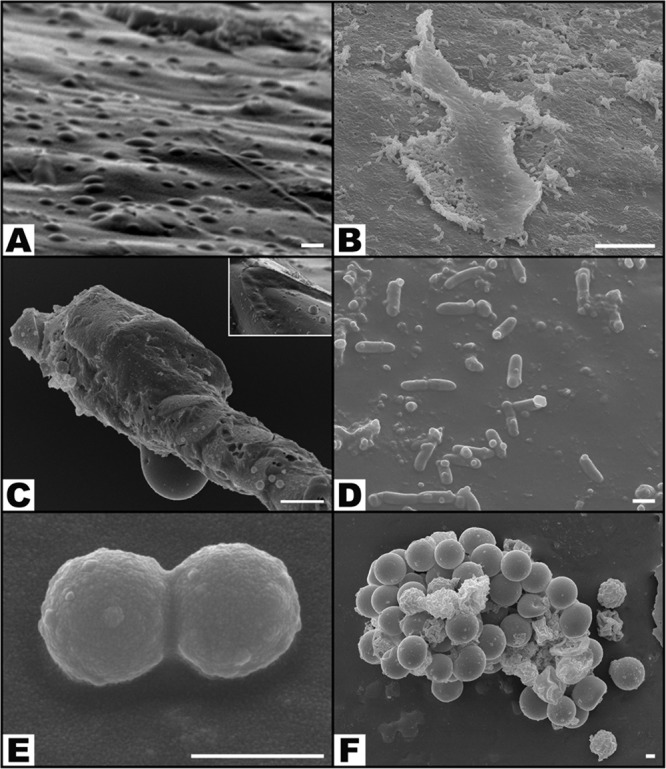
Figure 9.

Typical scanning electron microscopy images of the surface of catheters showing the variable distribution of bacteria. (A) Pseudomonas aeruginosa in the planktonic form; (B) P. aeruginosa are seen forming a large flat biofilm in the central portion of the image; (C) Small cocci (contamination) are seen on the surface of an hair shaft that contaminated the surgical wound; the box represents an higher amplification view of the middle portion of the hair shaft (D) P. aeruginosa cells are seen scattered on the surface of the catheter; some of these cells are dividing; amongst P. aeruginosa, it is possible to observe cocci; (E) Diplococcus; (F) Staphylococcus. Calibration bar = 1 µm (A, D, E, F); 10 µm (B,C)
