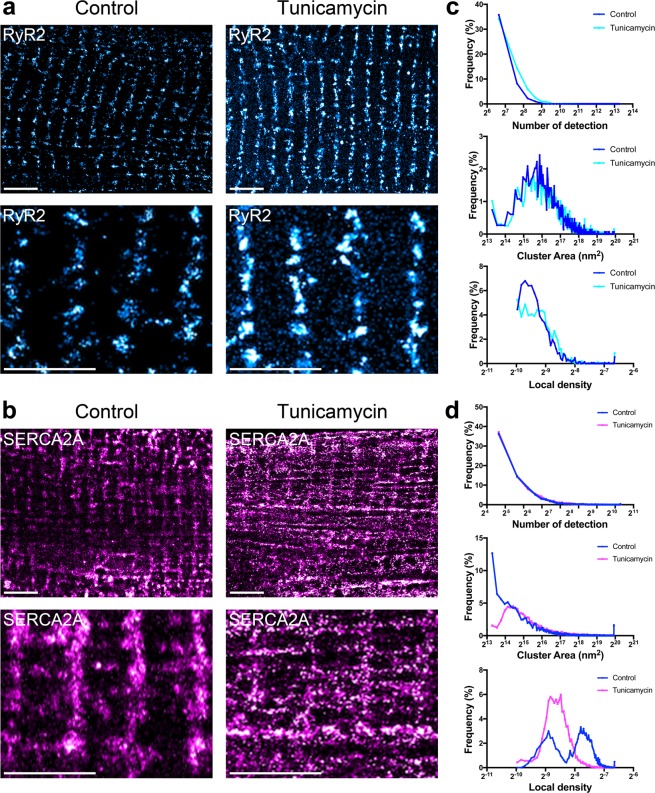
Figure 2.
dSTORM imaging reveals cellular stress induces nanoscale changes in SR protein cluster properties. (a–d) Adult mouse ventricular cardiomyocytes were isolated, treated with control and 5 μg/mL tunicamycin conditions, and immunofluorescence was conducted to visualize (a) RyR2 and (b) SERCA2A by dSTORM imaging. (c,d) Voronoi tessellation was performed to quantify and plot changes in protein cluster properties, number of detection, cluster area, and cluster density (right). (a,b) Top panels scale bar = 3 μm, bottom panels scale bar = 2 μm. N = 10 cells per protein per condition.

