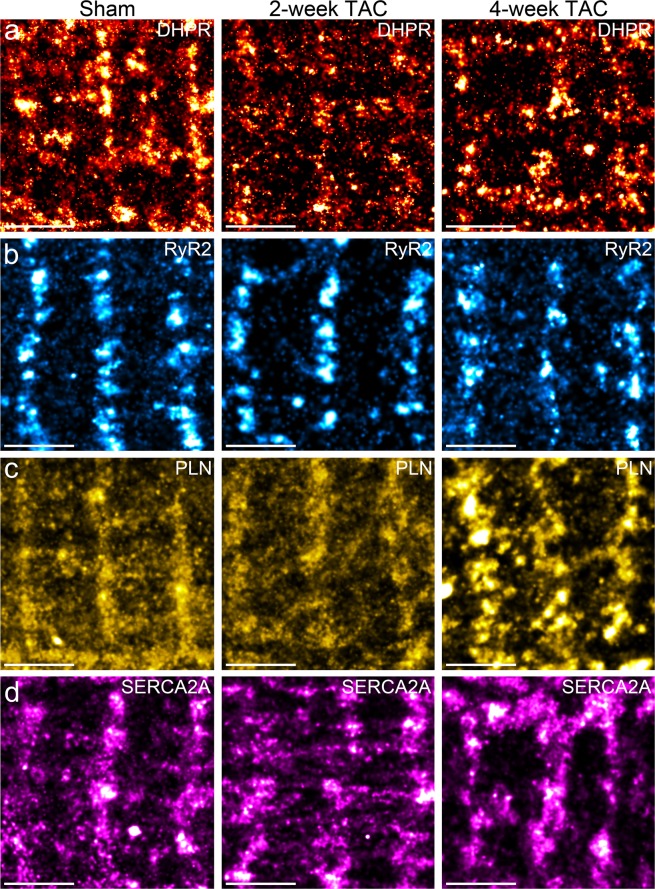
Figure 4.
Pathological cardiac hypertrophy induces qualitative, visual differences in clustering properties of major SR Ca2+ regulating proteins. (a–d) Representative magnified regions of the dSTORM images reveal distinct, visual differences in the cluster properties of target SR proteins in adult mouse cardiomyocytes isolated from TAC pressure-overload hearts (a) DHPR, (b) RyR2, (c) PLN, and d) SERCA2A. Scale bar = 2 μm. Sample size: 10–12 cells per protein per condition, n = 3.

